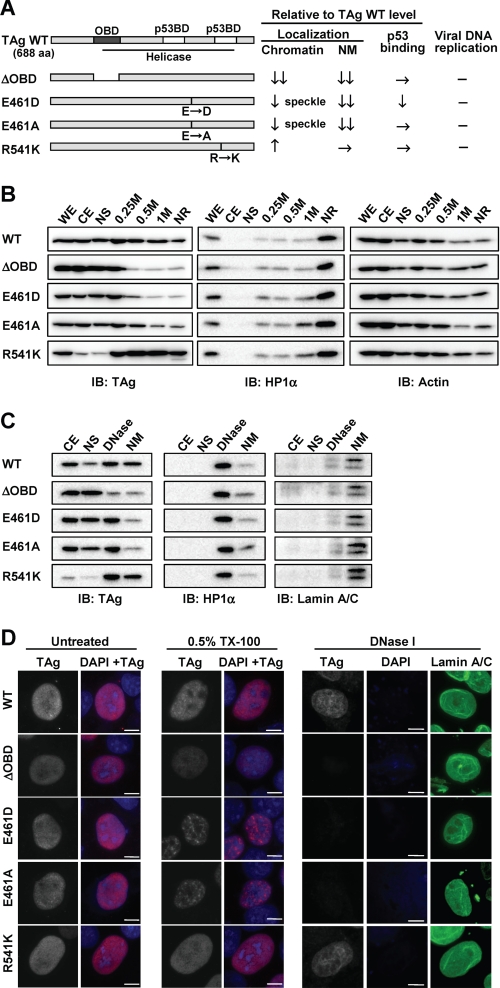
FIGURE 5.
Subcellular localization of WT and mutant forms of TAg. A, schematic representation and summary of intracellular properties of the mutant forms of JCV TAg. Predicted functional domains of JCV TAg were shown in TAg wild-type (WT, 688 amino acid (aa)). OBD, ori DNA binding domain (dark gray, 138–247 aa); p53BD, p53 binding domain (light gray, 351–450 and 534–628 aa); Helicase domain (under bar, 132–628 aa). ΔOBD lacks residues of WT 147–251 aa. The positions of amino acid point mutations for E461D, E461A, and R541K are indicated by black bars. The results of subcellular localization as shown in B–D, and p53 binding and the viral DNA replication assay for TAg mutants as shown in supplemental Fig. 6 were summarized as relative to those of TAg WT; decrease (↓), high decrease (↓↓), increase (↑), equivalence (→), and no activity (−). B, IMR-32 cells expressing FLAG-tagged WT or mutant forms of JCV TAg were subjected to sequential subcellular fractionation and salt extraction of insoluble nuclear material as described under “Experimental Procedures.” WE, whole cell extract; CE, cytoplasmic extract; NS, nuclear soluble extract; 0.25 m, 0.25 m NaCl nuclear extract; 0.5 m, 0.5 m NaCl nuclear extract; 1 m, 1 m NaCl nuclear extract; IB, immunoblot. Equal amounts of protein for each fraction were subjected to immunoblot analysis with antibodies to FLAG (for detection of TAg), HP1α, and actin (loading control). C, IMR-32 cells expressing WT or mutant forms of TAg were subjected to sequential subcellular fractionation followed by DNase I treatment and ammonium sulfate extraction to separate chromatin-associated proteins (DNase) from nuclear matrix-associated proteins (NM). Equal amounts of protein for each fraction were subjected to immunoblot analysis with antibodies to FLAG, HP1α, and lamin A/C. D, HeLa cells expressing WT or mutant forms of TAg were fixed with methanol either directly (nontreated, NT) or after extraction with 0.5% Triton X-100 without (0.5% TX-100) or with (DNase I) subsequent DNase I treatment and ammonium sulfate extraction. The cells were then subjected to immunofluorescence staining with antibodies to TAg (gray scale or red) or lamin A/C (green). DNA was also stained with DAPI (blue). The gray-scale images were obtained under the same conditions. Scale bars, 10 μm.

