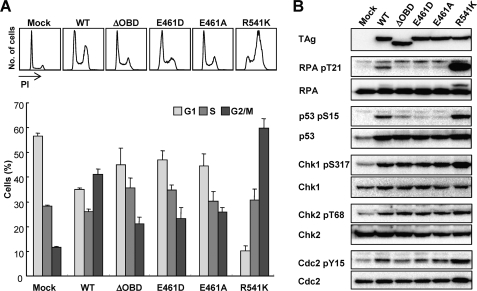
FIGURE 6.
Effects of mutation of JCV TAg on the induction of G2 arrest. A, flow cytometric analysis of the cell cycle profile either of the TAg+ cell subset of IMR-32 cells transfected with expression vectors for FLAG-tagged WT or mutant forms of TAg, or of the total cells transfected with the corresponding empty vector (mock). The histograms indicate DNA content as revealed by staining with PI and FITC-labeled antibodies to TAg. The bar graph shows the corresponding percentages of cells in each phase of the cell cycle; data are mean ± S.D. of triplicates from a representative experiment. B, immunoblot analysis of phosphorylated or total forms of the indicated proteins in IMR-32 cells transfected as in A.

