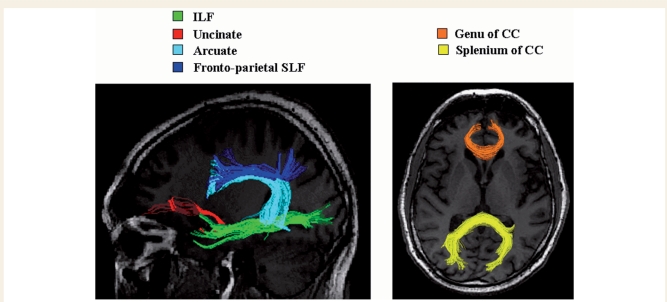
Figure 2.
Reconstructions of white matter tracts in a single healthy control: the left ILF in green, the left uncinate fasciculus in red, the left arcuate fasciculus in cyan, the left fronto-parietal SLF in blue, the genu of the corpus callosum in orange and the splenium of the corpus callosum in yellow. Tracts are superimposed onto the subject's T1-weighted image normalized into the FA space. CC = corpus callosum

