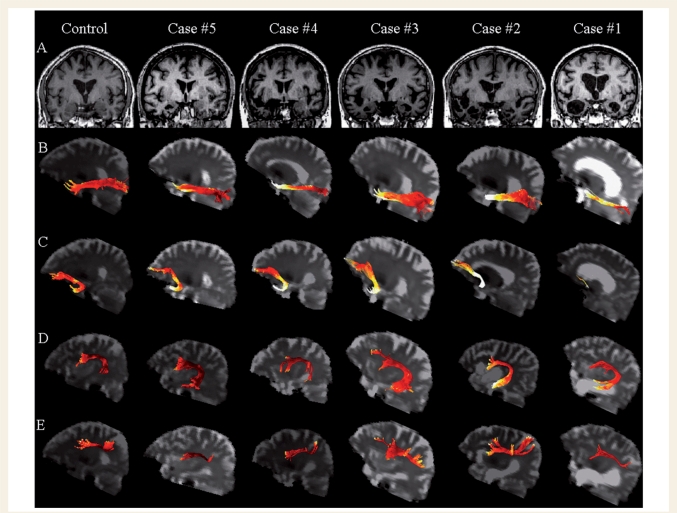
Figure 5.
(A) Structural MRI of one representative control and each semantic dementia patient (coronal view). (B–D) Left language-related white matter tracts are rendered as maps of MD in one representative control and all patients (B: ILF; C: uncinate fasciculus; D: arcuate fasciculus; E: fronto-parietal SLF). The colour scale represents the MD values going from lower (dark red) to higher values (yellow to white). Maximum damage is present in the anterior portion of the ILF and uncinate fasciculus underlying the temporal pole.

