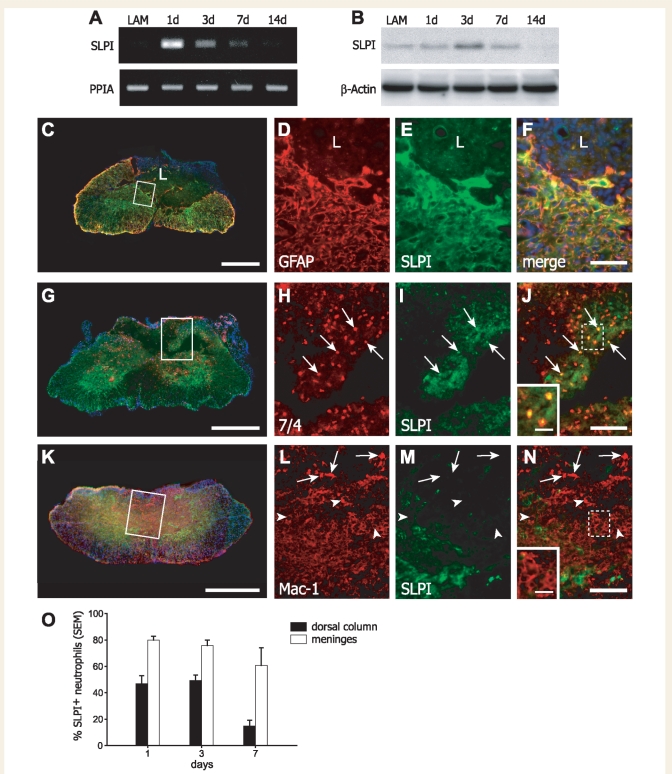
Figure 1.
Expression of SLPI after spinal cord injury. (A) RT–PCR analysis of SLPI mRNA expression after spinal cord injury shows upregulation 1, 3 and 7 days after injury with levels returning to control [laminectomized (LAM)] levels by Day 14. Peptidylprolyl isomerase A (PPIA) is used as a control. (B) Western blot analysis also shows increased SLPI protein expression during the first week after spinal cord injury, reaching a peak at 3 days. β-actin is used as a loading control. (C) Double immunofluorescence labelling of a cross-section of the spinal cord for GFAP and SLPI. Note the increased expression of SLPI (green) in reactive astrocytes (red) bordering the lesion at 14 days post-injury (L = lesion). Note also the SLPI labelling of neuron-like cells (green) in the ventral horn (also see Supplementary Fig. 4E–G). The area outlined in the box is shown in higher magnification in panels D–F. (D–F) Higher magnification shows strong SLPI immunoreactivity (E) in reactive astrocytes (D) along the border of the lesion; the merged image is shown in panel F. (G) Double immunofluorescence labelling of spinal cord cross-section labelled for neutrophils (antibody 7/4) (red) and SLPI (green) at 1 day post-injury. Note also the SLPI labelling in the ventral horn, which appear to be neurons. (H–J) Higher magnification of the area outlined in the box in panel G is shown in H–J. Some neutrophils (H) (arrows) also express SLPI (I); the merged image is shown in panel J. The insert in J shows higher magnification of the area outlined in the dashed lines showing SLPI labelling in neutrophils. (K) Double immunofluorescence labelling of a cross-section of the spinal cord for CD11b (macrophage-1 antigen; Mac-1) and SLPI at 7 days post-injury. Note the lack of SLPI (green) expression in Mac-1+ (red) macrophages and microglia. The area outlined in the box in panel K is shown in higher magnification in panels L–N. (L–N) Mac-1+ macrophages (arrowheads) and microglia (arrows) do not express SLPI (M); the merged image is shown in panel N. The insert in N shows higher magnification of the area outlined in the dashed lines showing no SLPI labelling in macrophages. (O) Percentage of SLPI+ neutrophils in the meninges and spinal cord parenchyma at various times after spinal cord injury. Scale bars: C, G, K = 500 µm; F, J, N = 100 µm; inserts in J and N = 25 μm. A minimum of three mice were analysed for each time point for the immunofluorescence, RT–PCR and western blot analyses.

