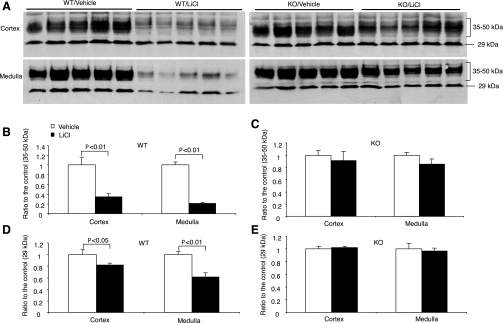
Fig. 3.
Renal aquaporin-2 (AQP2) protein abundance in mPGES-1 WT and KO mice following treatment with vehicle or LiCl. A: representative immunoblots of AQP2 in the cortex (top) and the medulla (bottom). B–E: densitometric analysis: WT/35–50 kDa (B), KO/35–50 kDa (C), WT/29 kDa (D), and KO/29 kDa (E). Values are means ± SE; n = 5.

