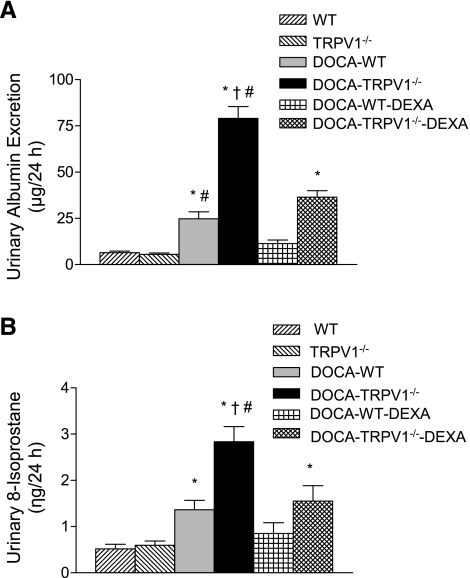
Fig. 2.
Bar graphs show the urinary albumin (A) and 8-isoprostane (B) excretion in WT and TRPV1−/− mice, and DOCA-salt-treated WT and TRPV1−/− mice with or without dexamethasone (DEXA) treatment. Values are means ± SE (n = 7 to 8). *P < 0.05 compared with control WT or TRPV1−/− mice. †P < 0.05 compared with DOCA-salt-treated WT mice. #P < 0.05 compared with DOCA-salt-treated WT or TRPV1−/− mice with DEXA treatment.

