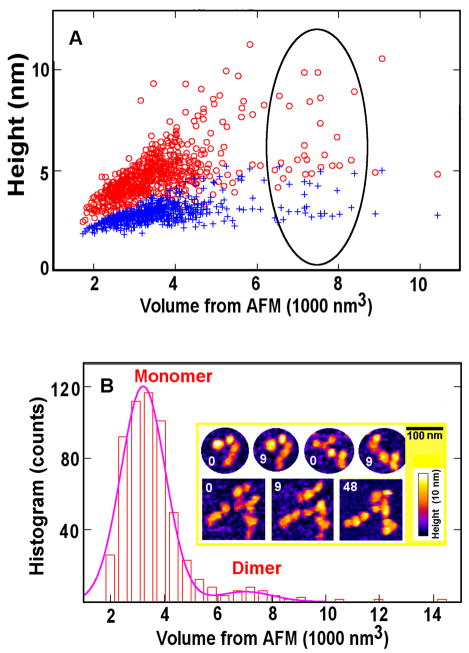
Fig.2.
Analyses of wet triskelia shown in Fig. 1 indicate particles mostly corresponding to individual triskelia and a few dimers. (A) Height/volume analysis: the red and blue symbols indicate the maximum and mean heights, respectively, detected within each protein particle of a given volume (abscissa). Dimers correspond to points inside the oval. (B) Histogram distribution of protein volumes calculated from the data set in (A). Insert: Triskelion dimers demonstrate structural changes in sequential AFM frames taken at 0, 9, and 48 min, the top row showing two dimers and the bottom row showing four triskelia that switch interaction partners.

