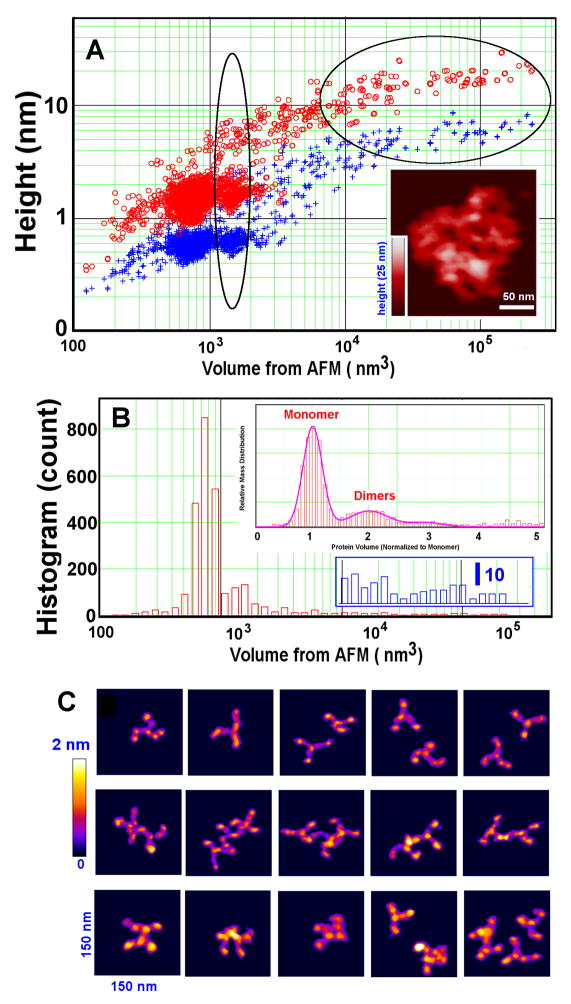
Fig.4.
Additional quantification of clathrin in Fig. 3. (A) AFM height/volume analysis reveals discrete populations of i) triskelion monomers with maximum volume ca. 760 nm3, ii) dimers (vertical oval region), and iii) a distribution of larger particles consistent with flattened cage structures (horizontal oval region). Red and blue symbols are the maximum and average apparent heights, respectively. (Insert shows an example of large flattened cages; see, also, Fig. 3A). (B) Histogram distribution obtained from 2724 particles, showing that triskelia and dimers dominate the topological profiles (top insert, relative protein mass distribution) and that larger assemblies are also present (lower insert, particle counts on an enlarged scale; identical abscissa). About 46% of the protein mass is found in a few large cage assemblies containing 100 to 300 triskelia (insert in (A)). (C) Examples of triskelion monomers (top row), non-compact dimers (middle row), and compact dimers (bottom row), viewed on a 2 nm color height scale.

