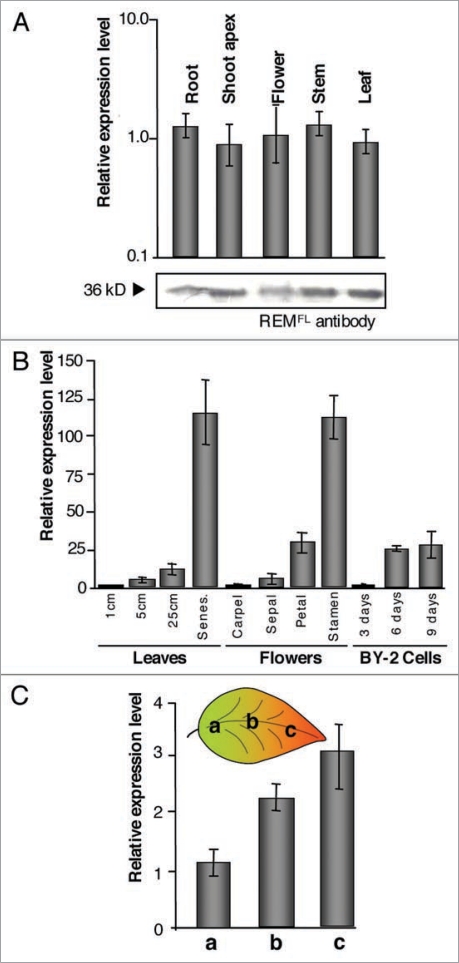
Figure 1.
REM gene expression and protein accumulation throughout tobacco plant. (A) top: NtREM1.2 gene expression in various plant organs. Bottom: Anti-REM western blot perform on protein extract from the same organs using polyclonal antibodies to REMFL as described in.3 (B) Variations of NtREM1.2 expression with leaves development, nature of flower tissues and BY-2 cells time of culture. (C) Left: REM protein accumulation monitored by western Blot does significantly vary between limb and nerve tissues of the leaf. Right: NtREM1.2 expression increases between sink (a), sink-source transition (b) and source (c) areas of the leaf. Gene expression is monitored by Q-RT-PCR, relative to eF1α gene expression in the same sample. error bars show standard deviation for 9 technical/biological replicates.

