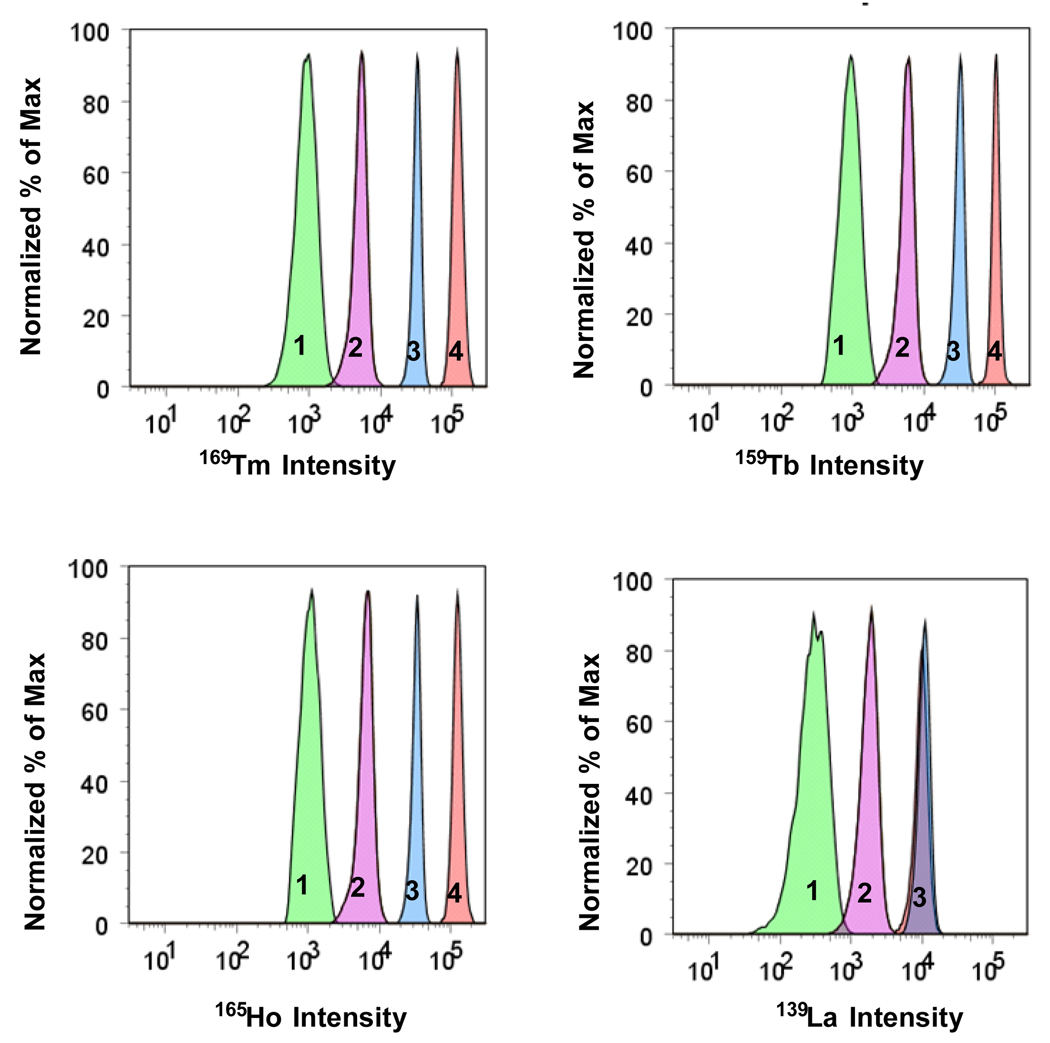
Figure 4.
Distribution of signal intensity for encoding elements for four different populations of microspheres. The microspheres were encoded with four elements (La, Ho, Tb, and Tm) and five levels of concentration (coded from “0” to “4”). For this system of encoding the variability is equal to 624. The green distribution is for “1”,”1”,”1”,”1” (sample AA100, #156) corresponding to La, Ho, Tb, and Tm, respectively. The violet distribution is for microspheres “2”,”2”,”2”,”2” (AA099, #312). The blue distribution is for microspheres “3”,”3”,”3”,”3” (AA087, #468). and the orange distribution is for microspheres “3”,”4”,”4”,”4” (AA093, #499). Note that two samples, AA087 and AA093, both have concentration level “3” of La. The encoding numbers (#156, #312, #468, #499) were assigned using the formalism presented in Supporting Information.

