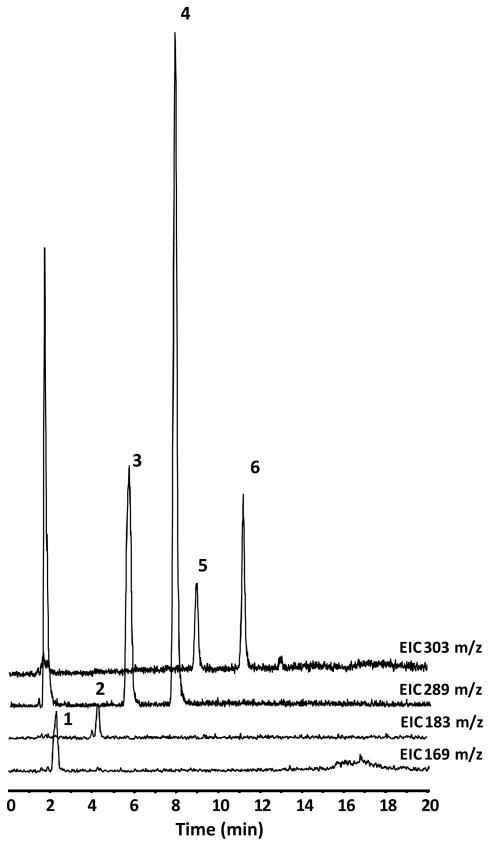
Figure 3.
LC-MS separation of major GSPE phenolic constituents from an extract of rat plasma. LC-MS conditions can be seen in Material and Methods. Extracted ion chromatograms at169, 183, 289, and 303 m/z are shown. Peak identifications can be seen in Table 1.

