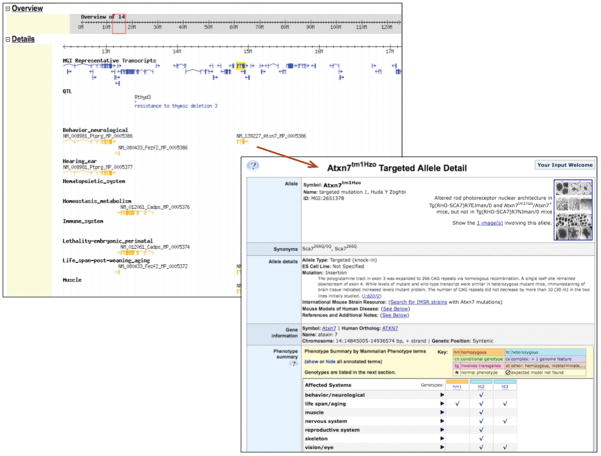
Figure 4.
Example of phenotype annotations displayed on the Mouse Genome Browser. Left, a region of chromosome 14 including the Atxn7 gene is shown. Tracks representing high-level phenotypes of genes in this region are shown along with tracks indicating known alleles of the genes. The gene model graphics in the phenotype or allele tracks are hyperlinked to the allele record that describes that mutation, shown on the right.

