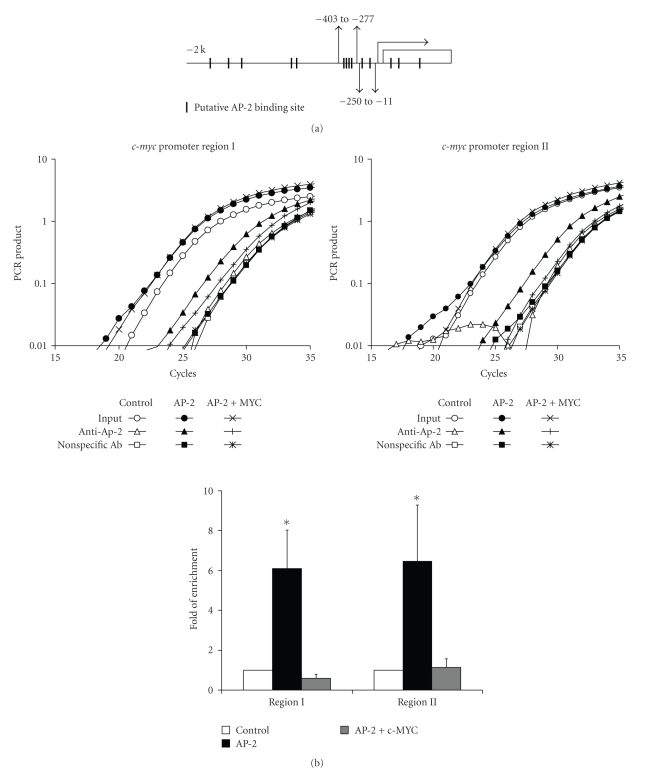
Figure 6.
AP-2α protein bound to c-myc 5′ flank regulatory region. (a) Diagram of the location of AP-2 putative binding sites in c-myc 5′ flank regulatory region (short columns). The gray short arrow heads represent the primers for ChIP assay. (b) Overexpression of AP-2α caused enrichment of two promoter regions DNA with anti-AP-2 antibody in ChIP assay. Region I (−403 to −277) and Region II (−250 to −11) were both enriched about 6 folds. Cooverexpression of c-MYC (50 MOI) decreased AP-2 binding to c-myc promoter back to basal level. Upper panels are representative amplification curves of the real time PCR for ChIP assay; lower panel is a plot of the quantification of the data calculated with ΔΔCt. Error bars stand for standard deviation (SD), n = 3. *P < .05 compared to control.

