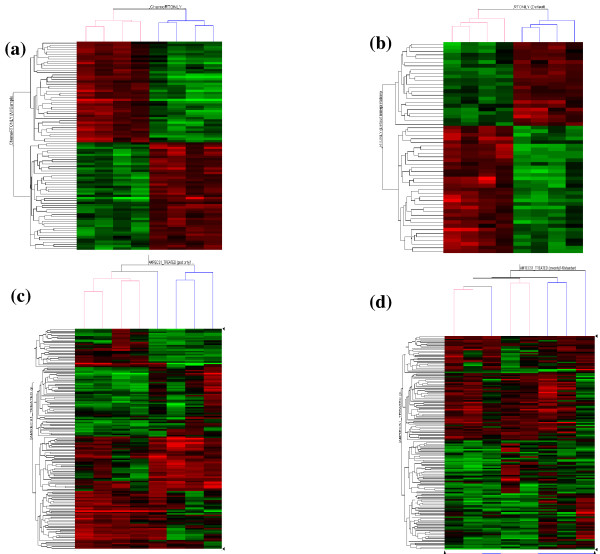
Figure 1.
Hierarchical cluster analysis of chemoradiotherapy or radiotherapy treated tumours. This analysis separates pre- and post-treatment biopsies using (a) 86 genes identified as changed in chemoradiotherapy treated patients and (b) 51 genes identified as changed in short course radiotherapy treated patients. (c) Post-treatment tumour biopsies, cluster according to treatment received with the combined set of 137 genes, but (d) pre-treatment tumour biopsies do not. Columns represent tumour samples and rows represent genes (red: up-regulated and green: down-regulated, radiotherapy [blue] or chemoradiotherapy [pink]).

