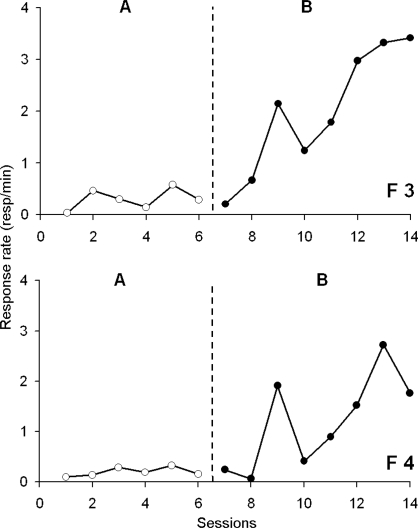
Fig 5.
Response rate (responses/min) as a function of experimental sessions for 2 flies F3 and F4 involved in the AB design. The vertical dotted line shows the switch from the baseline level (“A”, open circles) to the continuous reinforcement schedule (“B”, closed circles). These 2 flies worked for 14 consecutive days.

