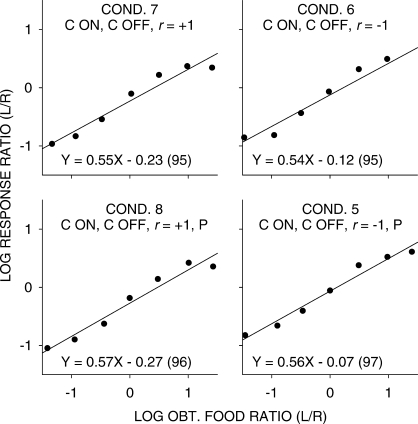
Fig 2.
Pooled data. Log response ratios as a function of log food ratios in the seven components in conditions in which stimulus onset was response contingent (C ON). The straight lines were fitted by least-squares linear regression, and the equations of these lines (with percent variance accounted for in parentheses) are shown for each condition.

