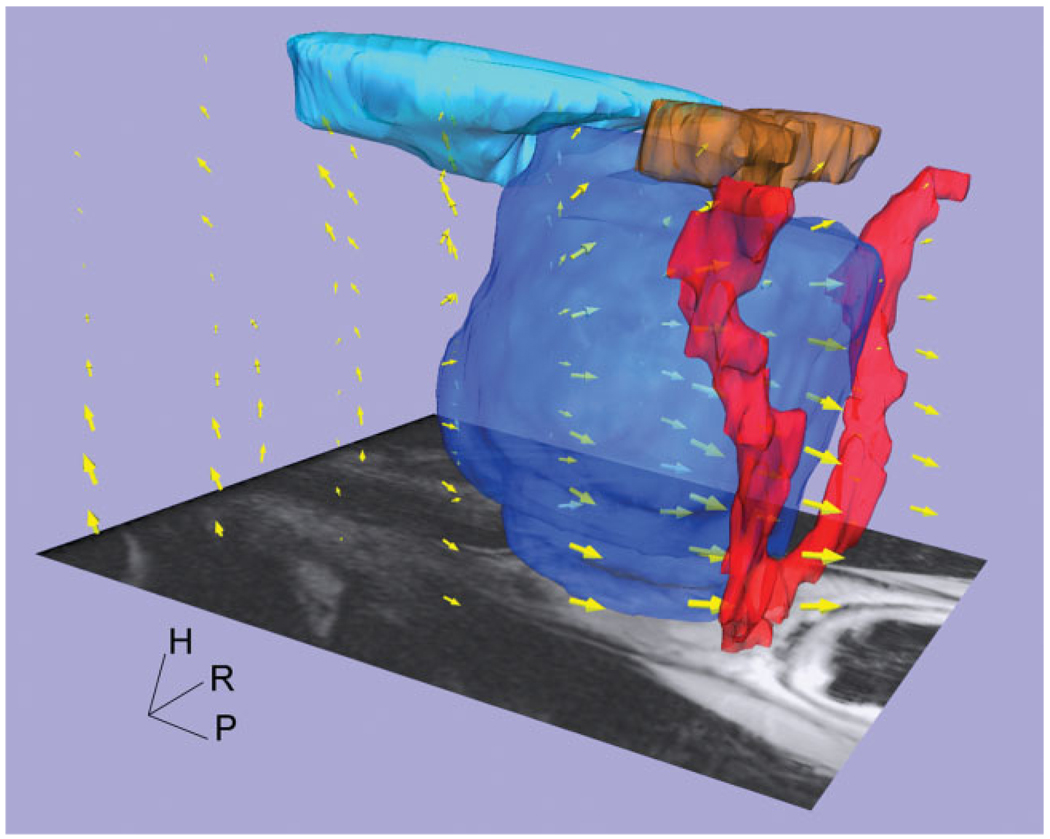
Figure 6.
Three-dimensional representation of deformation vector field, shown with normal pelvic anatomical models (prostate [dark blue], bladder [light blue], seminal vesicle [brown], and neurovascular bundle [red]). Yellow arrows’ size describes magnitude of deformation. Larger deformations are present at the posterior part of the prostate. The 3D deformation vector map was obtained using the ParaView software package.

