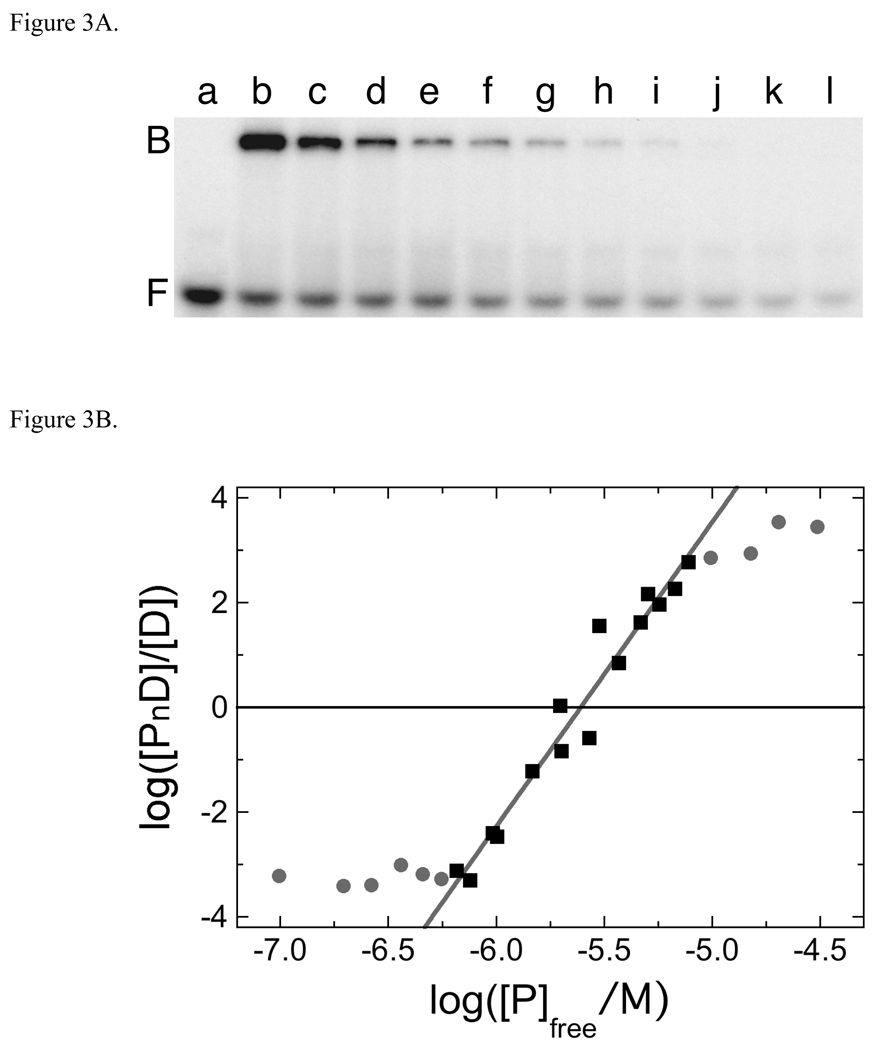
Fig. 3.
Serial dilution analysis of the AGT complex formed with dA24•dT24. Panel A. Binding detected by EMSA. Sample a: 24-mer DNA (1.10 × 10⁻⁷ M) only. Sample b: 24-mer DNA (1.10 × 10⁻⁷ M) plus AGT (5.36 × 10⁻⁶ M). Samples c-l are sequential 1.33-fold dilutions of sample b. All samples were equilibrated in buffer consisting of 10mM Tris (pH 7.6), 100 mM NaCl, 1 mM DTT, 0.05 mg/mL bovine serum albumin for 30 min at 20 ± 1°C prior to resolution on native gels as described in Methods. Although this image has been cropped and labeled for clarity, no additional bands were detectable between the origin of electrophoresis and the ionic front. Panel B. Graph of the dependence of log[PnD]/[D] on log[P] for the AGT complex formed with dA24•dT24. Data from the experiment shown in Fig. 3A and others that provide additional [AGT] values. The line represents a least squares fit to the data ensemble for the range about the mid-point of the reaction (−6.18 ≤ log ([AGT]/M) ≤ −5.11), with [AGT]free calculated as described in Experimental Procedures. Symbols: the points used in the fit are indicated by (■) other points in the data set are indicated by closed circles (●). The slope equals 5.81 ± 0.34 for this subset of the data.

