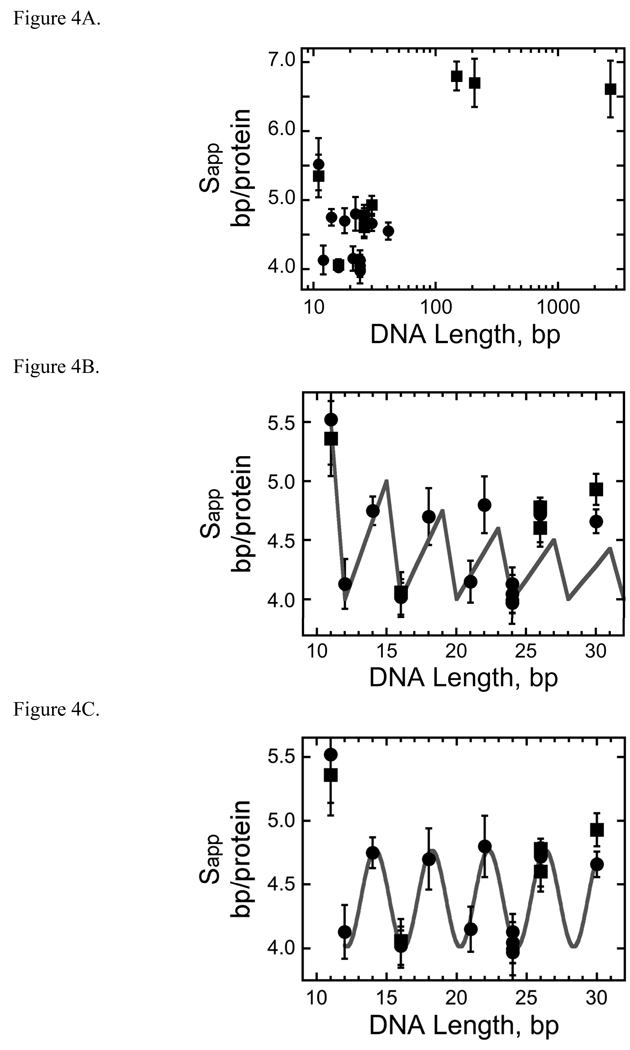
Fig. 4.
AGT forms a binding motif with a 4 bp periodicity. Panel A. Dependence of apparent binding site size (Sapp) on template length. Data from the entire set of AGT-dsDNA complexes. Sapp was calculated using Sapp = N/n, where N is DNA length in base pairs and n is the number of protein molecules bound to a DNA molecule. Sapp values determined from sedimentation equilibrium data are indicated by filled squares (■), values obtained from EMSA experiments are indicated by closed circles (●). The error bars correspond to 95% confidence limits. These data are also shown in Table 2. Panel B. Comparison of experimental and theoretical Sapp values as a function of DNA length. Experimental Sapp values determined from sedimentation equilibrium data are indicated by filled squares (■), values obtained from EMSA experiments are indicated by closed circles (●). The error bars correspond to 95% confidence limits. Theoretical Sapp values (solid line) were calculated using Sapp= N/nmax where nmax is the largest integer ≤ N/4. Panel C. Data for the subset of AGT-DNA complexes formed with DNAs of 41 bp or less. Data symbols are defined as in Panel A. The smooth curve is the least-squares fit of the equation3 Sapp = A cos (BL) + C in which A is the amplitude of the oscillation, B the displacement angle in degrees/bp and C is an offset equal to the mean value of Sapp. This fit returned A = −0.37 ± 0.04, B = 88.7 ± 0.5 degrees and C = 4.39 ± 0.02. This value of B indicates that successive binding sites are separated by 360/(88.7 ± 0.5) = 4.05 ± 0.02 bp along the DNA contour.

