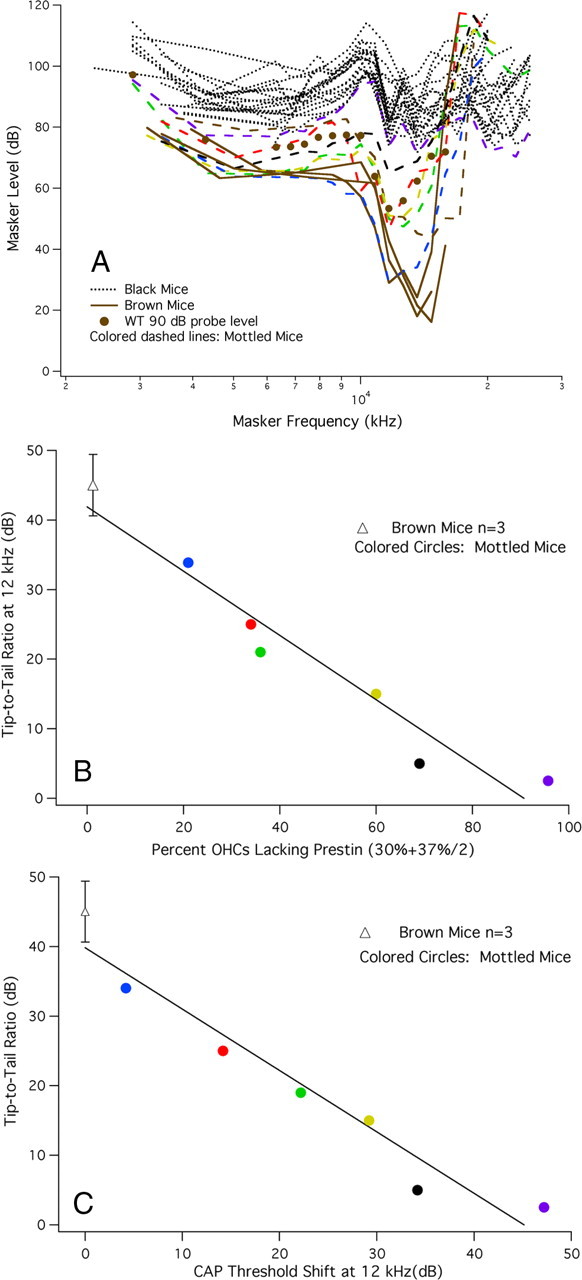
Figure 8.

A, CAP tuning curves at 12 kHz in chimeric mice. Similar to the changes in threshold, CAP tuning curves at 12 kHz were WT like in brown mice (solid lines) and KO like in black mice (dotted lines). Mottled mice (colored dashed lines) exhibited a decreasing tip-to-tail ratio as the number of OHCs containing prestin decreased. The average probe level for brown mice was 54 dB, for black mice, 93 dB and for mottled mice 74 dB. B, For brown and mottled mice, the tip-to-tail ratio is plotted as a function of the percentage of OHCs lacking prestin. This latter metric is computed over a distance located between 30 and 44% of the distance from the apex. Brown mice (open triangle) are represented by their mean and SD, while data for mottled, chimeric mice are plotted individually as colored circles. C, In this panel, tip-to-tail ratio is plotted as a function of CAP threshold shift at 12 kHz for brown mice, represented by their mean and SD, and for mottled mice plotted individually. It should be understood that a full dataset was not collected on each mouse. This related to shipping difficulties such that some mice arrived when they were much older than is ideal for making round-window recordings. In addition, some mice displayed anatomical anomalies that prevented CAP recording and in other instances tissue was lost in the region coding for the 12 kHz probe. Hence, our inability to provide results for a larger number of mottled mice.
