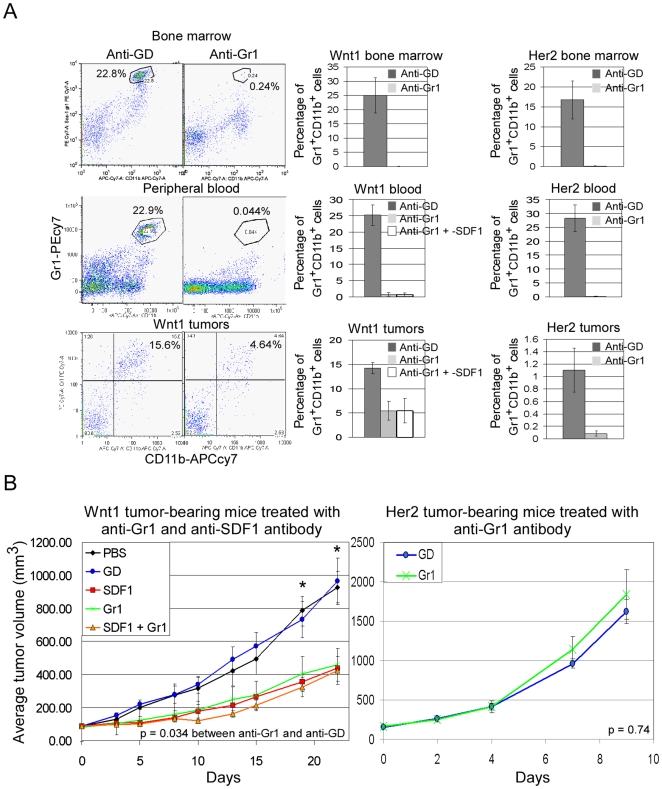
Figure 6. Tumor-bearing mice treated with anti-Gr1 and anti-SDF1 antibody.
A, FACS profiles and histogram plots of percentage of Gr1+CD11b+ cells in the bone marrow, peripheral blood, and tumors of Wnt1 and Her2 tumor-bearing mice treated with anti-GD (dark bars), anti-Gr1 (light bars), or anti-Gr1 and -SDF1(white bars) antibody. Error bars represent standard deviations derived from analysis of three independently treated mice. B, average tumor volumes of Wnt1 (left panel) or Her2 (right panel) tumor-bearing mice treated with controls, PBS (black) and anti-GD (blue), and with anti-SDF1 (red), -Gr1 (green) and both -SDF1 plus -Gr1 (orange) antibodies. Average tumor volume was determined from n = 5 mice per treatment group, and error bars represent +/− SEM. * indicates average tumor volumes that are statistically different between anti-GD and anti-Gr1 treatment groups (p<0.05).

