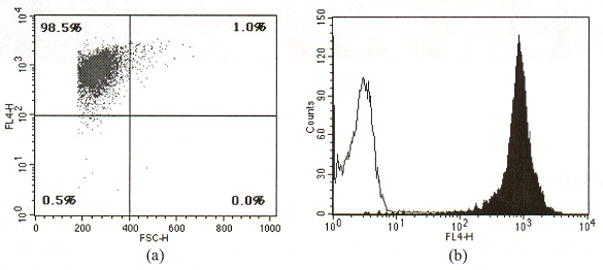
Fig. 2.

A typical result of in vitro flow cytometry of a DiD-labeled cell population. The X-axis in the scatter plot (a) represents forward scattering, which is correlated to cell size (increasing with cell diameter). The Y-axis represents the intensity of fluorescence labeling. About 99% of the labeled cells are the size of T cell, appearing in the upper left quadrant of the fluorescence and scattering plot. However, about 1% of population (upper right quadrant) is comprised of cells bigger than T cells or potential cell aggregates. The histogram (b) demonstrates that fluorescence intensity of DiD-labeled cells is well separated from unlabeled control cells.
