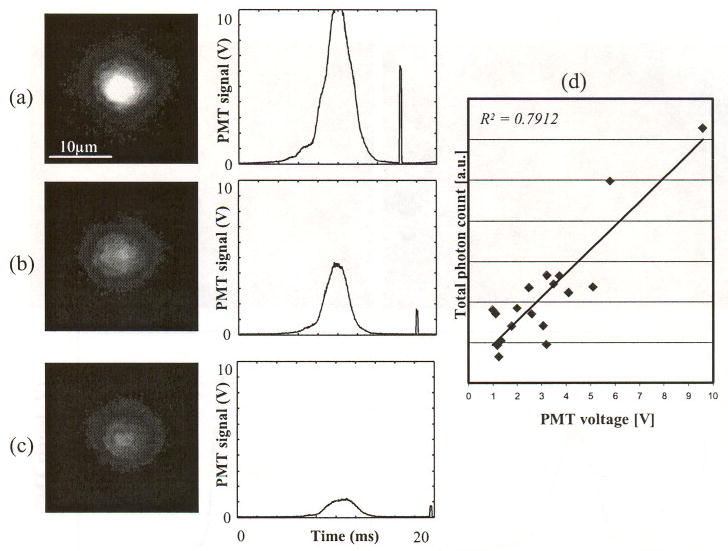
Fig. 6.

In vivo images of DiD-labeled T cells and corresponding PMT traces, (a) brightest, (b) medium brightness, (c) darkest cell, and (d) the total photon count against PMT voltage. The first bell-shaped pulse is induced by a cell passing through the slit. The second short pulse is induced by the imaging pulse. Since the gain for the PMT and the intensified CCD camera were constant for these measurements, the difference in brightness is intrinsic to the cell labeling.
