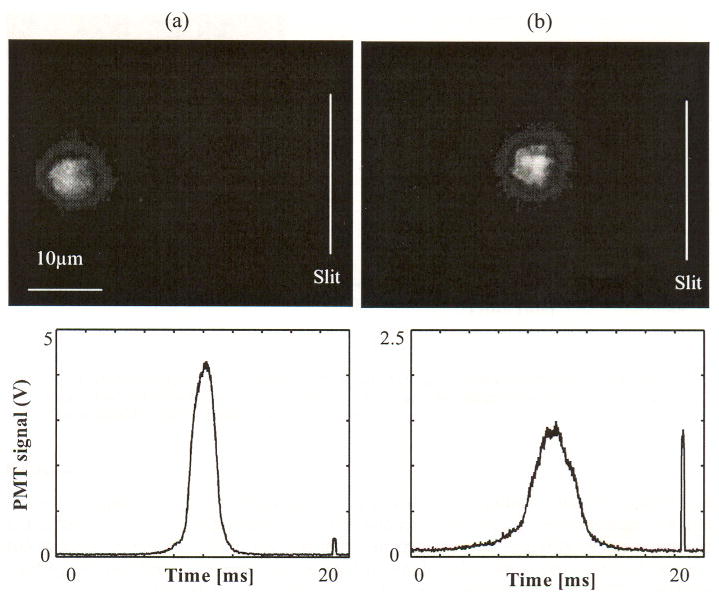
Fig. 7.

In vivo image of cells in circulation with different speed and corresponding PMT traces. The speed was estimated a straight path from the slit to the captured position, (a) a fast cell with a speed of 3.8 mm/s and (b) a slow cell with a speed of 2.1 mm/s.
