Fig. 8.

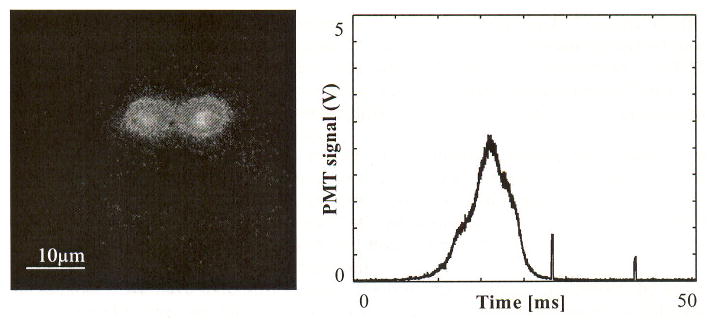
In vivo image of a cell with two consecutive imaging pulses and corresponding PMT trace. Two pulses are temporally separated by 20 ms and the image pulse duration is 400 μs. The measured traveling speed of cell is 0.67 mm/s.

In vivo image of a cell with two consecutive imaging pulses and corresponding PMT trace. Two pulses are temporally separated by 20 ms and the image pulse duration is 400 μs. The measured traveling speed of cell is 0.67 mm/s.