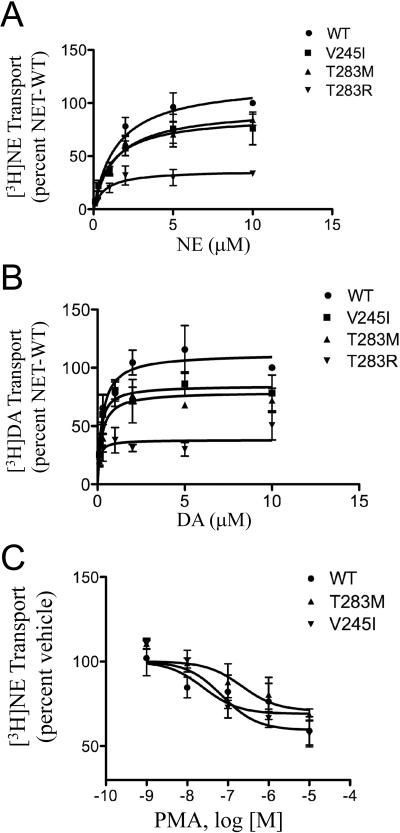
Figure 3.
Functional analysis of NET protein variants. Saturation kinetics of [3H]NE (A) and [3H]DA (B) uptake of NET and variant NETs. CAD cells were transiently transfected with NET or variant cDNAs. Twenty-four hours later, saturation transport assays were performed as described in Materials and Methods. Transport was determined by incubating cells for 10 min with 100 nM to 10 μM [3H]NE or [3H]DA, and nonspecific activity was defined by 1 μM desipramine at each concentration. Data are expressed as the percentage of NET transport at 10 μM concentration of substrate and are the mean ± S.E.M. values of three experiments. KM and VMAX values were determined using Prism as described in Materials and Methods. Data were analyzed using one-way ANOVA followed by Dunnett's test. Effects of μ-PMA treatment on [3H]NE transport by NET and variants (C). CAD cells were transfected with NET or variant cDNAs. Twenty-four hours later, μ-PMA treatment was performed as described in Materials and Methods. Cells were treated for 10 min with 1 nM-10 μM β–-PMA followed by a 10 min incubation with 50 nM [3H]NE. Data points are mean ± S.E.M. of percent inhibition of total uptake (vehicle) for each NET construct versus the log of drug concentration for three experiments. KI values for the inhibition of [3H]NE uptake by β-PMA were calculated with nonlinear regression analysis according to a single-site competition model (Prism). One-way ANOVA followed by Dunnett's post-hoc test were used.

