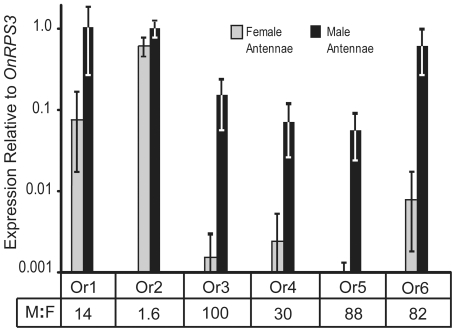
Figure 1. Male-biased expression of five ECB(Z) sex pheromone receptor genes.
Ratios of male to female expression (M:F) are presented below each bar. Gene expression, determined by real-time quantitative PCR with SYBR green, is reported relative to the reference gene OnRPS3 on a logarithmic scale. Expression values are presented as averages (with standard error bars) of four biological replicates and three nested technical replicates. Sex-biased expression is supported by nested ANOVA analyses of the normalized CT values, P = 0.03, 0.04, 0.001, 0.06, 0.001 and 0.003, OnOrs1-6 respectively.

