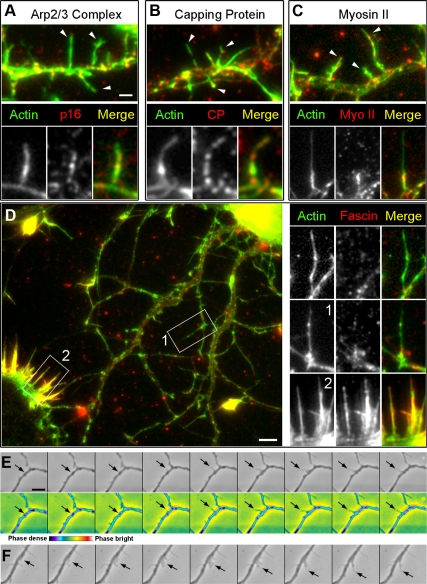
Figure 7.
Molecular markers and dynamics of dendritic filopodia. (A–D) Fluorescence staining of cytoskeletal components in filopodia of 7–11 DIV hippocampal neurons by phalloidin (green) and indicated antibodies (red) shown at low magnification (top, A–C, left, D) or high magnification (bottom, A–C, right, D). Dendritic filopodia in A–C are indicated by arrowheads. Boxes 1 and 2 from D are enlarged in side panels with corresponding numbers. Unlabeled top panel shows a dendritic filopodium from another dendrite. Box 2 shows fascin-positive growth cone filopodia in contrast to dendritic filopodia not containing significant amounts of fascin. (E and F) Time-lapse phase-contrast sequences showing initiation of dendritic filopodia (arrows) from phase-dense spots (E) or small lamellipodia (F) in 10 DIV neurons. Bottom panel in E shows a color-coded image from the top panel to emphasize the phase-dense patches (purple). Time intervals are 6 s (E) or 3 s (F). Bars, 2 μm (A–C), 5 μm (F), and 5 μm (E and F).

