Figure 4.

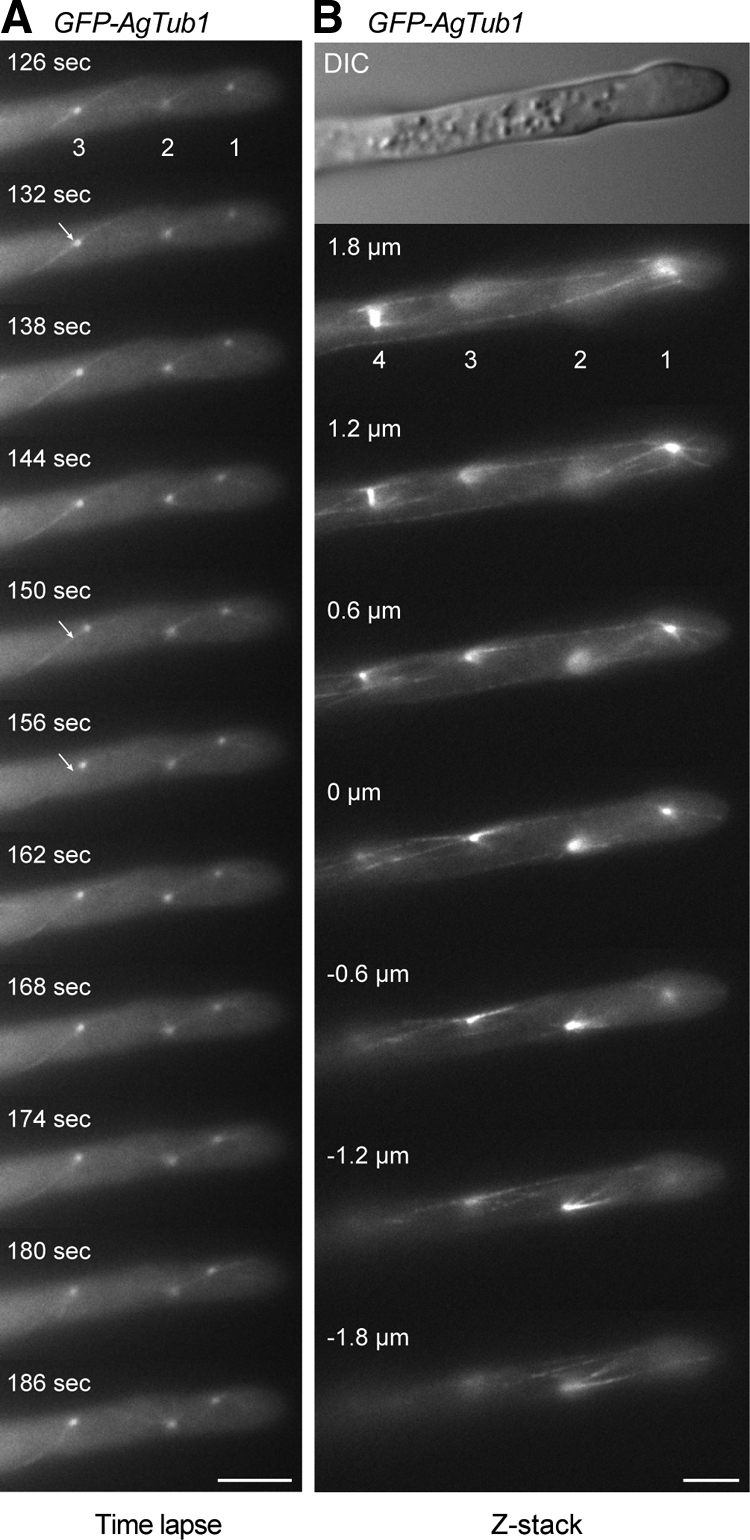
Motility of SPBs and visualization of cMT arrays. Hyphae expressing GFP-tagged and nontagged AgTub1 were pregrown and mounted for fluorescence microscopy on thin agar slices. Images were taken from a single Z-plane every 6 s with 1.5-s exposure time for 7 min (Supplemental Movie S3) or as Z-stack with 18 planes each 0.3 μm apart and 1.5-s exposure time (Supplemental Movie S4). (A) 11 representative frames of Movie S3 showing three SPBs as distinct dots and attached cMTs as thin, weakly fluorescent filaments. The apparent connection of SPBs 1 and 2 (frames 162–180 s) represents two cMTs superimposed by chance because both are visible as two independent cMTs in frame 186 s. Bar, 5 μm. (B) Images of selected focal planes of the Z-stack (Supplemental Movie S4) of a hypha expressing GFP-AgTub1. Four SPBs and attached cMTs are seen in the different focal planes. Short and long cytoplasmic microtubules emanate from both sides of bright foci representing SPBs (1–3) and from SPBs of a metaphase spindle (4). Short cytoplasmic microtubules frequently point toward the cell cortex; long cytoplasmic microtubules run along the longitudinal axis of the hyphae and can often be followed over several focal planes. They either terminate in the cytoplasm or seem to glide along the cell cortex. The SPB from nucleus 1 is connected to the cell cortex of the tip region by three short cytoplasmic microtubules, whereas at least three longer cytoplasmic microtubules run toward the distal part of the hypha. Bar, 5 μm.
