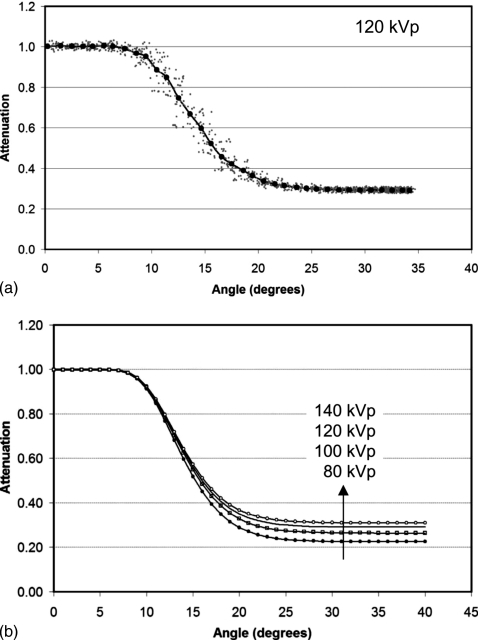
Figure 4.
(a) The bow tie function F(θ) is shown versus θ, computed from the two waveforms illustrated in Fig. 3d. The gray data points are the raw data, and the solid circles are the average values binned in 1° intervals. This curve is for the 120 kVp spectrum. (b) A computer fitting routine was used to further smooth the data shown in (a). Here, the smoothed attenuation versus angle profiles for 80, 100, 120, and 140 kVp are illustrated.

