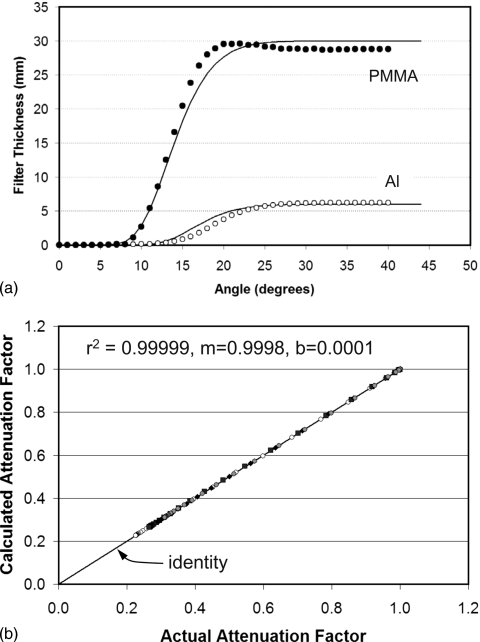
Figure 6.
(a) The actual thickness of PMMA and Al is shown (solid lines), and the PMMA (black circles) and Al (open circles) thicknesses computed using the proposed iterative method are shown as symbols. Although more accurate than the simpler method whose results are shown in Fig. 5a, this approach does show a compensatory effect where overestimates of one material are balanced by underestimates of the other. (b) The computed attenuation is shown plotted versus the actual attenuation, and for the iterative method, the results are quite accurate—as indicated by the ∼unit slope and ∼zero intercept. The key to the symbols is defined in Fig. 5b.

