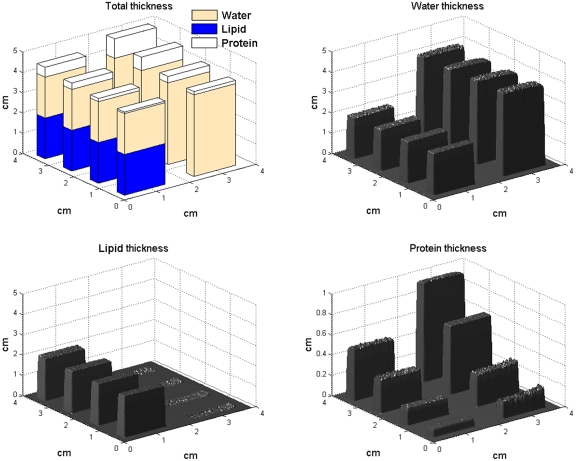
Figure 5.
Deconvolution images for a 4-cm section of the test phantom made from three materials representing water, lipid, and protein. Top left: Drawing representing true thicknesses of each phantom section. The estimated thicknesses for water (top right), lipid (bottom left), and protein (bottom right) are all within 2% of the actual thickness for water and lipid, and 13% for protein. The protein concentrations are similar to mammalian tissue and range from 5% to 30%.

