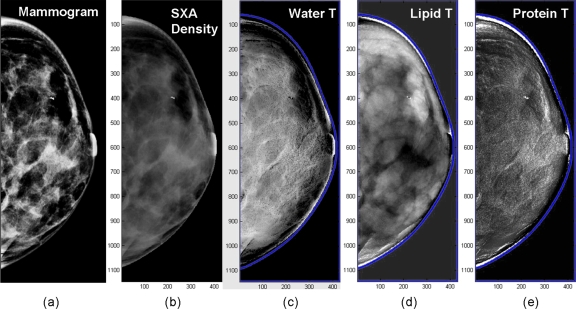
Figure 6.
Deconvolution of a mammogram into compositional images: (a) Regular mammogram, (b) two-compartment volumetric density image (gray scale=% fibroglandular volume), (c) water thickness (gray scale=water thickness), (d) lipid thickness (gray scale=lipid thickness), and (e) protein thickness (gray scale=water thickness) images, respectively.

