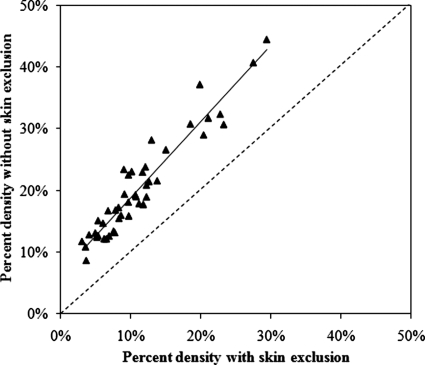
Figure 3.
Comparison between the percent densities measured with and without skin exclusion from all 50 analyzed cases, demonstrating the overestimated density without skin exclusion. A strong correlation is found. The best fitting equation is y=1.23x+7% (r=0.94, p<0.001), where y is the percent density with skin (i.e., without skin exclusion), and x is the percent density without skin (i.e., with skin exclusion). The slope is 1.23; therefore, the difference cannot be accounted for by using the intercept as an offset value.

