
Figure 3.
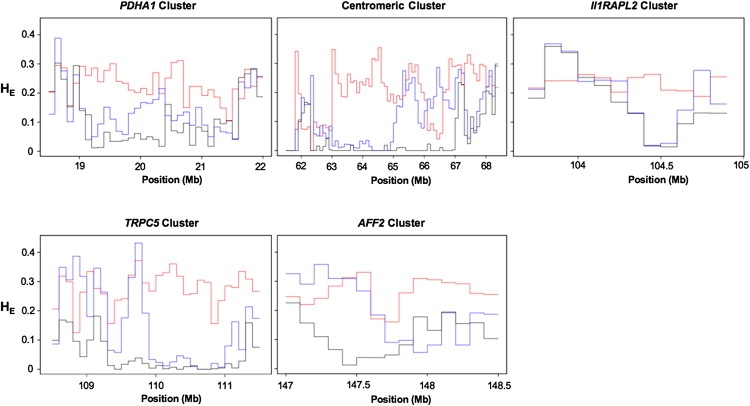
Levels of Genetic Variation in the Highly Differentiated Loci
Each panel displays profiles of normalized heterozygosity that were calculated with all HapMap SNPs in nonoverlapping, 100 kb bins. Red, blue, and black lines denote heterozygosity for the YRI, CEU, and ASN samples, respectively.