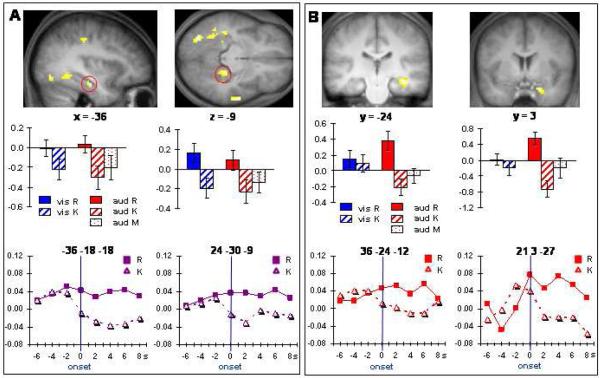
Figure 1.
Regions demonstrating modality-independent (A) and auditorily-selective (B) pre-stimulus subsequent memory effects (p < .0025), overlaid on sections of the across-subjects mean T1-weighted structural image. Bar graphs show mean parameter estimates and standard errors (arbitrary units) of the peak voxel of the indicated effect. Time-courses of the independent and selective effects at the same loci are shown below. Time-courses were averaged across cue-item intervals, and aligned at the onset of the study item (0 s). Signal amplitude is in arbitrary units.

