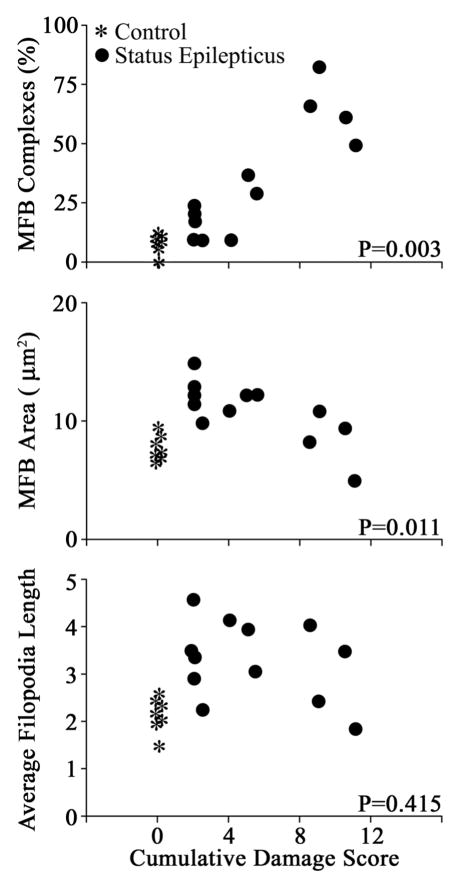
FIGURE 6.
Scatter plots showing significant correlations between loss of hippocampal neurons and changes in granule cell morphology. Cumulative damage score equals the combined semi-quantitative cell loss scores for the DG, hilus, CA1, and CA3 pyramidal cell layers (no loss = 0; >90% loss in all four regions = 12). Among pilocarpine treated animals (black dots), cumulative damage scores were significantly correlated with the percentage of giant mossy fiber boutons with satellites (MFB complexes) and MFB area. Although control animals are depicted in the scatter plots (asterisks), they were not included in the statistical analyses used to generate significant correlations. In the case of MFB complexes, inclusion of control animals produced even stronger correlations, as is evident in the plot. In the case of MFB area, intriguingly, inclusion of control animals revealed a bimodal effect of cell loss. By way of contrast, although giant mossy fiber bouton filopodia length was significantly increased 1 month after status relative to controls, this variable exhibited no correlation with cell loss among pilocarpine-treated animals. Each symbol represents an individual animal.

