
Fig 2. Correlation of mRNA and protein expression.
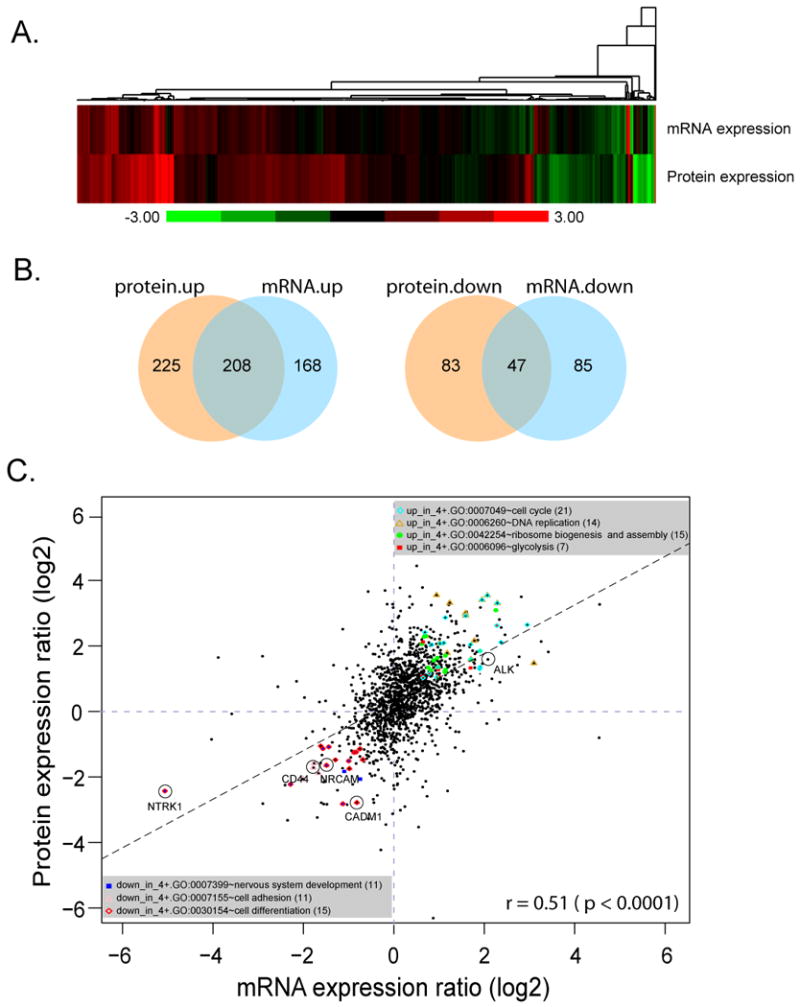
A. The heatmap of mRNA and protein expression ratio of 4+ vs. 1- tumor. B. Venn diagrams show the overlapping of differential up- and down-regulated genes in mRNA and protein expression. C. Scatter plot of protein expression vs. mRNA expression ratios. Ratios of 4+ to 1- tumor protein expression measured by ICAT are plotted against the corresponding mRNA expression ratios measured by Affymetrix genechip, the correlation coefficient is 0.51 (p < 0.0001). The linear regression line is shown as a dashed black line. Many genes with elevated mRNA or protein expression in 4+ tumor were involved in ribosome biogenesis, cell cycle, DNA replication and glycolysis, whereas genes involved in nervous system development, cell adhesion, and cell differentiation had reduced expression levels. The color codes for the genes involved in different biological processes are indicated in the figure. Genes ALK, NTRK1, CD44, NRCAM and CADM1 known to relate with neuroblastoma prognosis are marked in circle.