
Fig 4. Protein networks associated with the proteins differentially expressed in 4+ and 1- neuroblastoma.
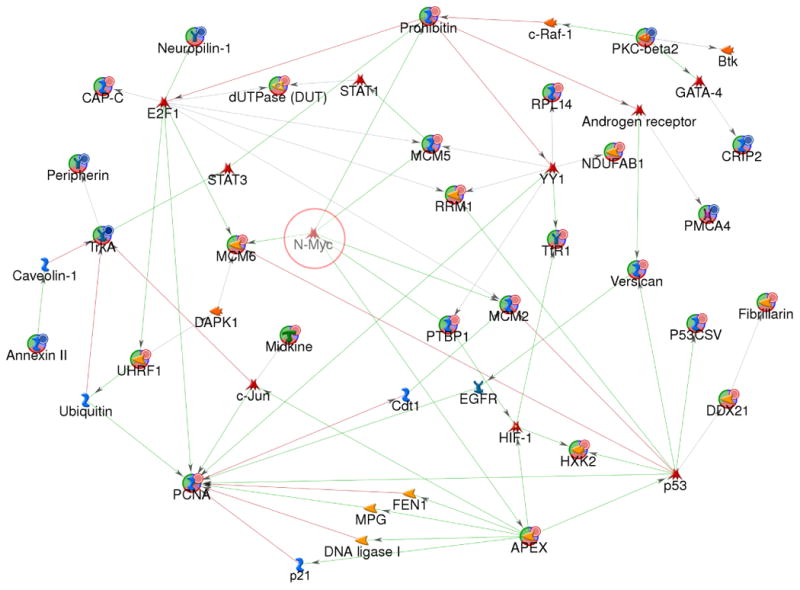
The network was generated by a shortest paths algorithm of MetaCore (GeneGo) software using the list of differentially expressed proteins identified ICAT and Affymetrix microarray analysis. Nodes represent proteins; lines between nodes indicate the interaction between proteins; the arrowheads indicate the direction of the interaction. Different shapes of the nodes represent the functional class of the proteins. The nodes with circular symbol represent the differential expressed proteins obtained from our experiment; otherwise obtained from MetaCore database. The lines between the nodes indicate the interactions of the nodes; the arrowheads indicate the direction of the interaction. The color of lines between nodes describes activation (green), inhibition (red), and unspecified (gray) interactions.  : over-expressed;
  : under-expressed;
  : transcription factor.