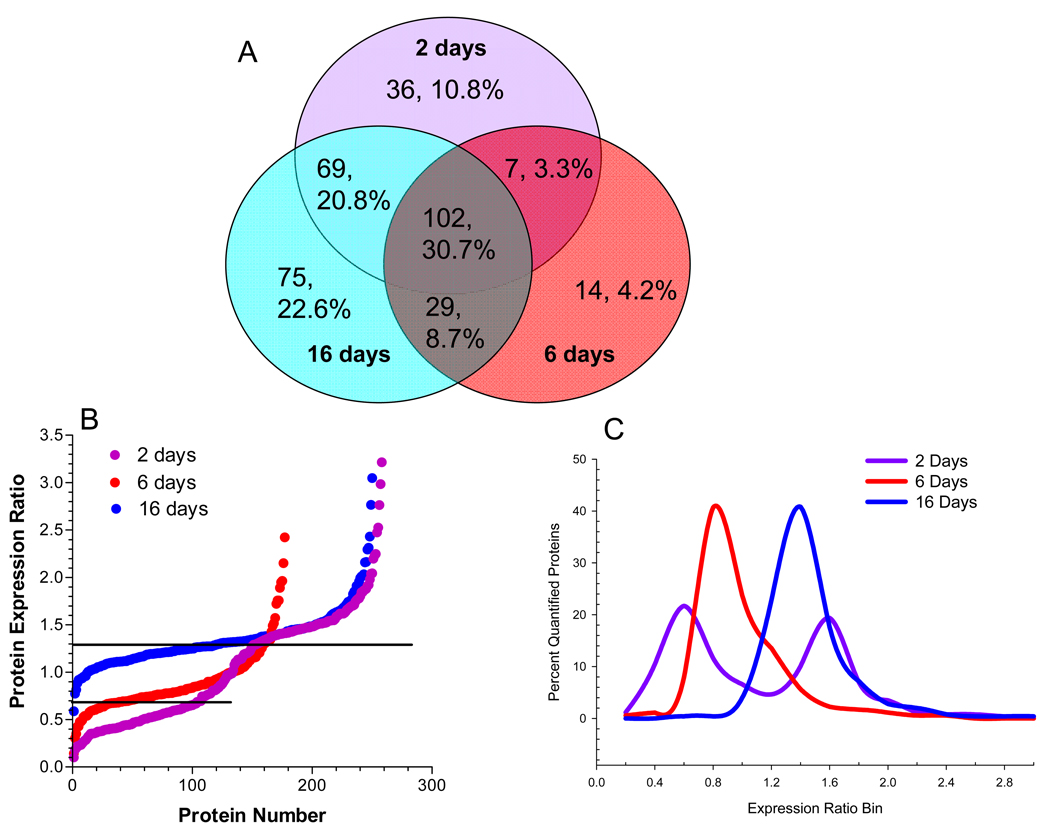
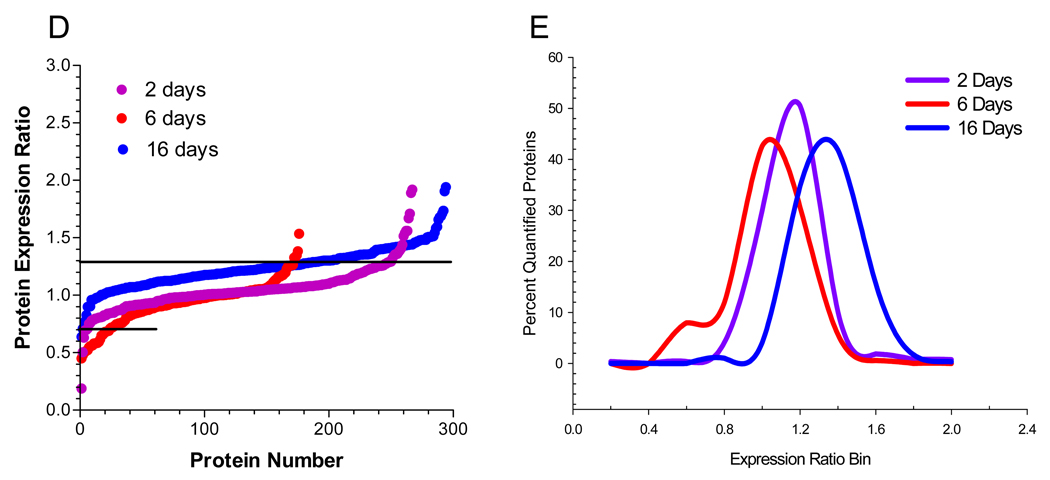
Figure 2. Hyperglycemia has Differential Effects on the Nuclear and Cytoplasmic Proteomes.
SCs were incubated in medium containing 5.5 mM (K0) or 30 mM (K6) medium for 2, 6 or 16 days and nuclear and cytoplasmic fractions were analyzed by GeLC-LTQ-FT MS/MS. (A) Venn diagram of number and percent of annotated nuclear proteins identified at each time point. To compare the effect of 2, 6, or 16 days hyperglycemia on the nuclear (B,C) or cytoplasmic (D,E) proteomes, the expression ratios were plotted versus protein number (B,D) or binned by 0.2 units and expressed as a percent of the total quantified proteins (C,E). Line indicates three times the standard deviation of the analytic variability and proteins between the lines did not show a significant change.


