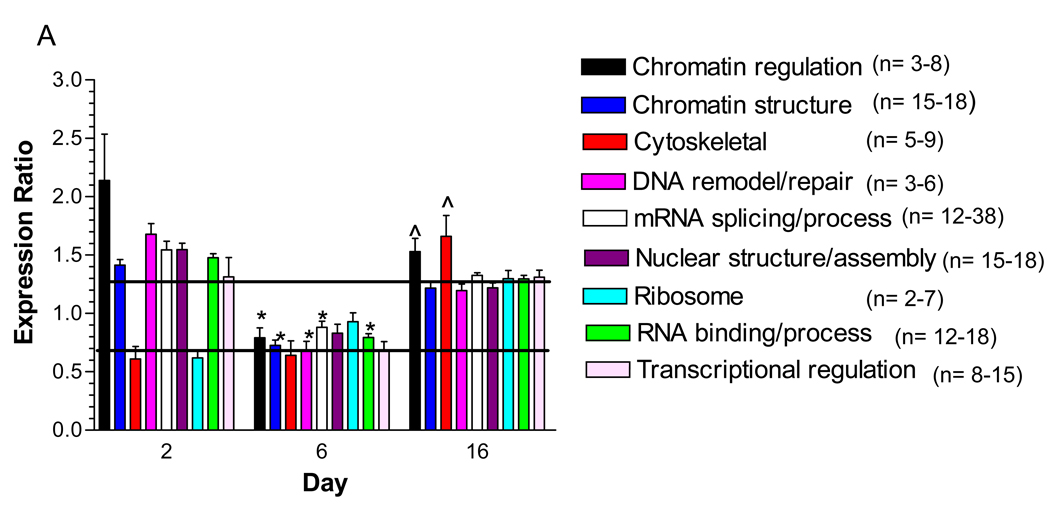
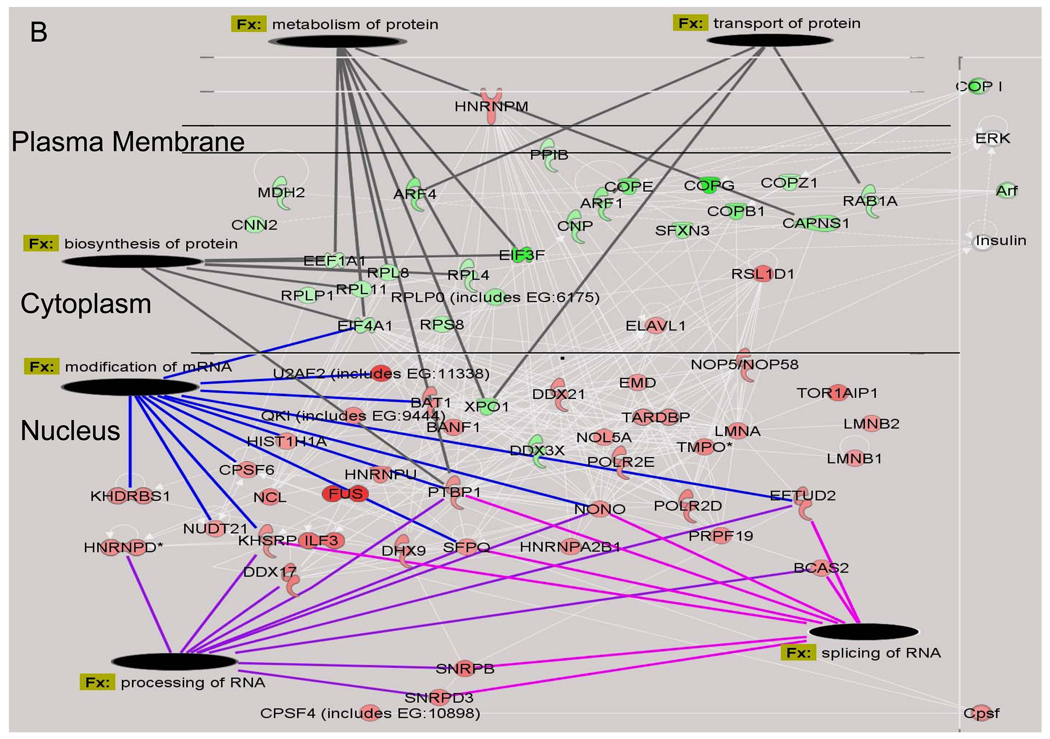
Figure 3. Identification of Functional Classes of Nuclear Proteins Affected by Hyperglycemia.
A) Quantified proteins were grouped based upon their annotated function. The expression ratios of all proteins associated with a function were averaged and the line indicates three times the standard deviation of the analytic variability associated with the quantitation. Categories above or below these limits define a significant change in expression. The number of quantified proteins per category is indicated in the legend. Significant differences between time points were determined using a one-way ANOVA and Tukey’s post hoc test. *, p< 0.05 compared to 2 days, ^, p < 0.05 compared to 6 days. B) The top two molecular networks affected after 2 days of hyperglycemia were identified using Ingenuity Pathway Analysis, merged and graphically presented to highlight the increase in proteins regulating mRNA processing and the decrease in proteins regulating protein synthesis, metabolism and transport. Gene names are identified in Supplementary Table 4.


