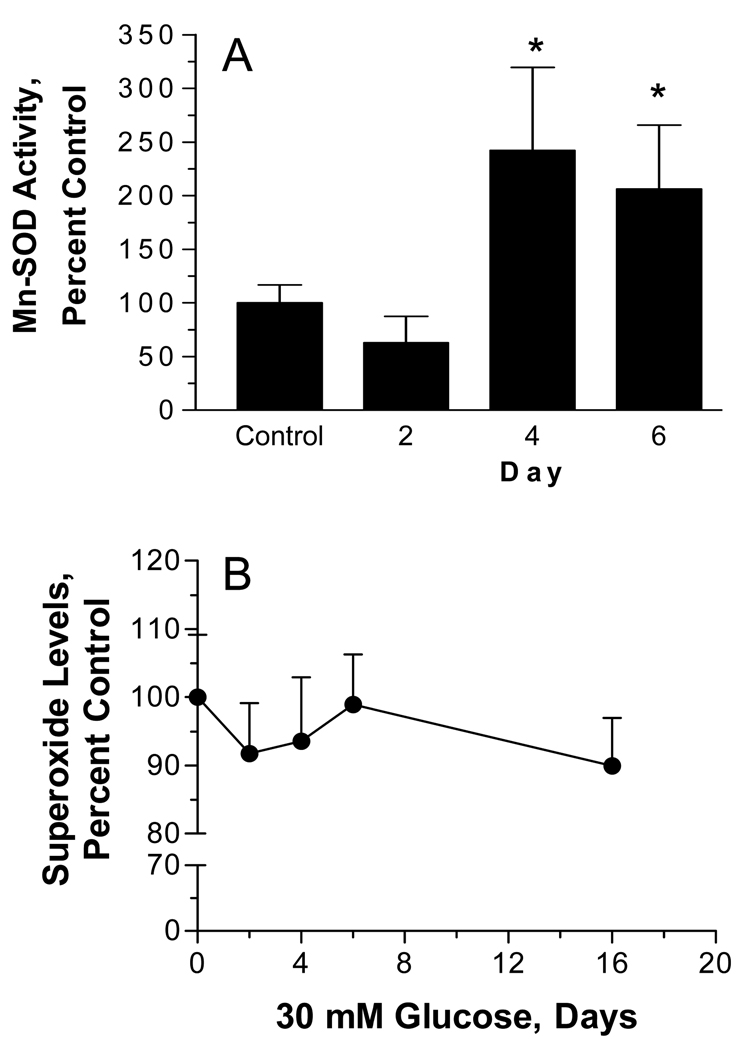
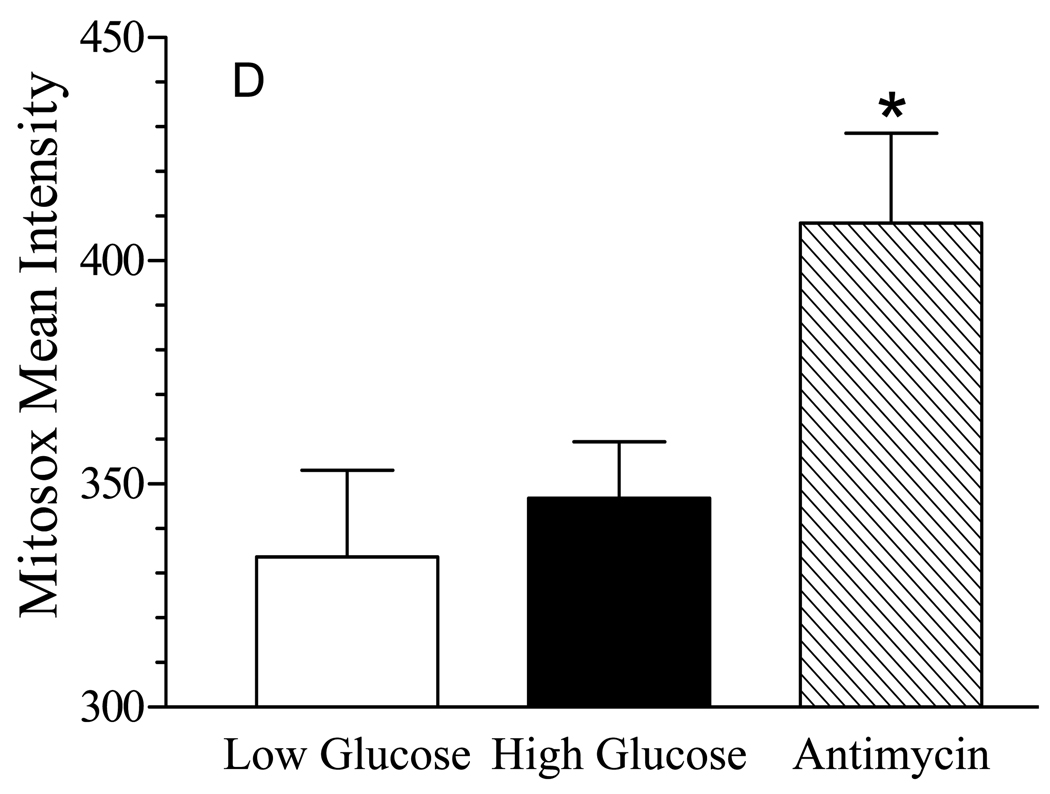
Figure 8. Acute Hyperglycemia Increased MnSOD Activity but not Superoxide Production.
(A) SCs were incubated with 5.5 mM or 30 mM glucose for the indicated time and a heavy mitochondrial fraction was isolated. MnSOD activity was determined after a 30 min preincubation with 2 mM NaCN to inhibit residual Cu/Zn SOD activity and results are the mean ± SEM from three separate experiments. Asterisks indicate p < 0.05 compared to control. (B) SCs were incubated with 5.5 mM or 30 mM glucose for the indicated time and cellular superoxide levels were determined after the addition of 3 µM dihydroethidine. Results are the mean of four experiments perform with 8 replicates each and are expressed as a percent of control. (C) SCs were incubated with 5.5 mM or 30 mM glucose for 6 days, treated with MitoSox Red and MitoTracker Green and mitochondrial levels of superoxide were visualized by confocal microscopy. Incubation with Antimycin A served as a positive control for mitochondrial superoxide generation. (D) Quantitative image analysis of superoxide levels. Results are from a representative experiment performed twice and are the mean ± SEM from at least 200 cells per treatment. Asterisk indicates p< 0.05 versus low and high glucose treatments.


