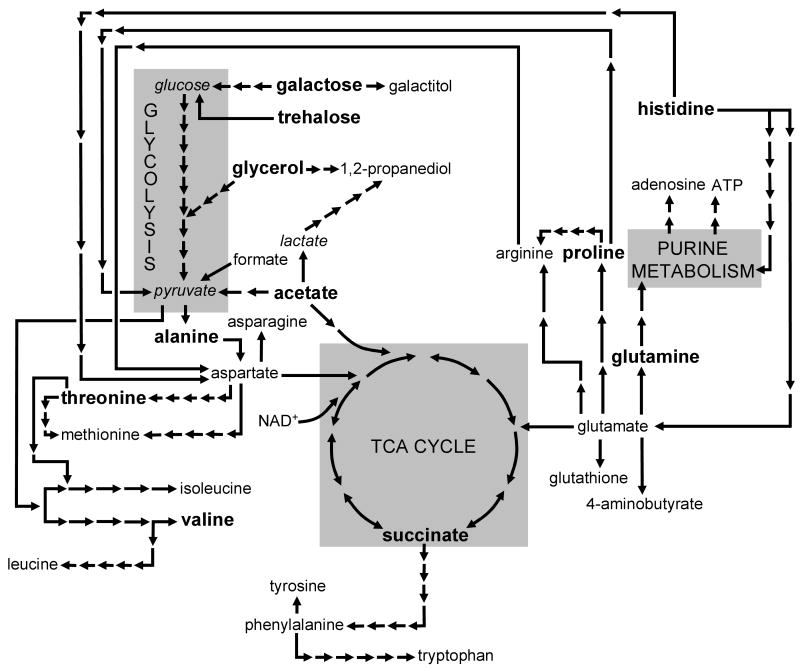
Figure 6.
Map illustrating the biochemical linkages among the primary metabolites identified in HD yeast. Only the most predominant metabolic pathways are shown for simplicity. Metabolites shown in bold underwent significant concentration changes in 25Q versus 103Q yeast. Arrows represent individual metabolic (enzymatic) steps required for biotransformation (note – italicized metabolites were not observed in yeast extracts, but represent known and important metabolic links).

