
Figure 7.
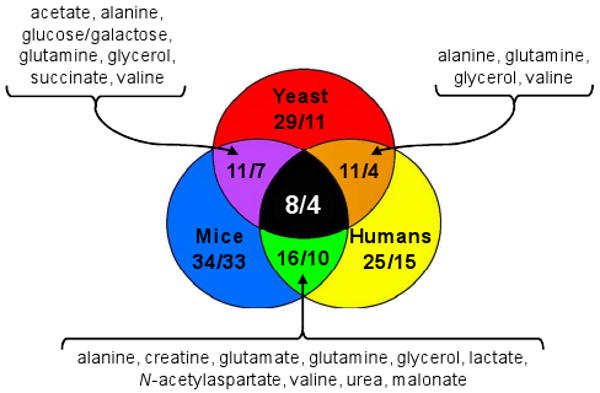
Venn diagram illustrating similarities among the metabolomes of humans, mice, and yeast expressing mHtt. Pairs of integers represent the number of metabolites identified within a given organism or set of organisms (first integer) versus the number of biomolecules that are reported to undergo significant concentration changes (second integer). Among the eight metabolites that are reported from all three HD systems, four (alanine, glutamine, glycerol, and valine) undergo significant shifts in concentrations following mutant huntingtin expression. The metabolites listed in the diagram are those found significantly altered in the three pair-wise comparisons (clockwise from left side: yeast and mice, mice and humans, and yeast and humans). A complete list of all metabolites is provided in Supporting Information, Table 2.