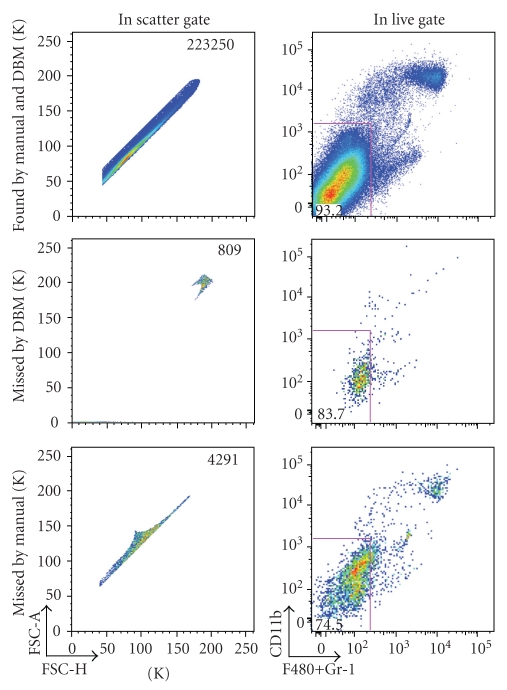
Figure 2.
Differences in manual versus DBM gating in scatter dimensions—cells included by both gates (top), cells included in the manual gate and excluded by the DBM gate (middle), and cells included in the DBM gate and excluded by the manual gate (bottom) are displayed (column 1). Cells are live/dead gated as described in the text, and shown in the context of the next manual gating decision (column 2).

