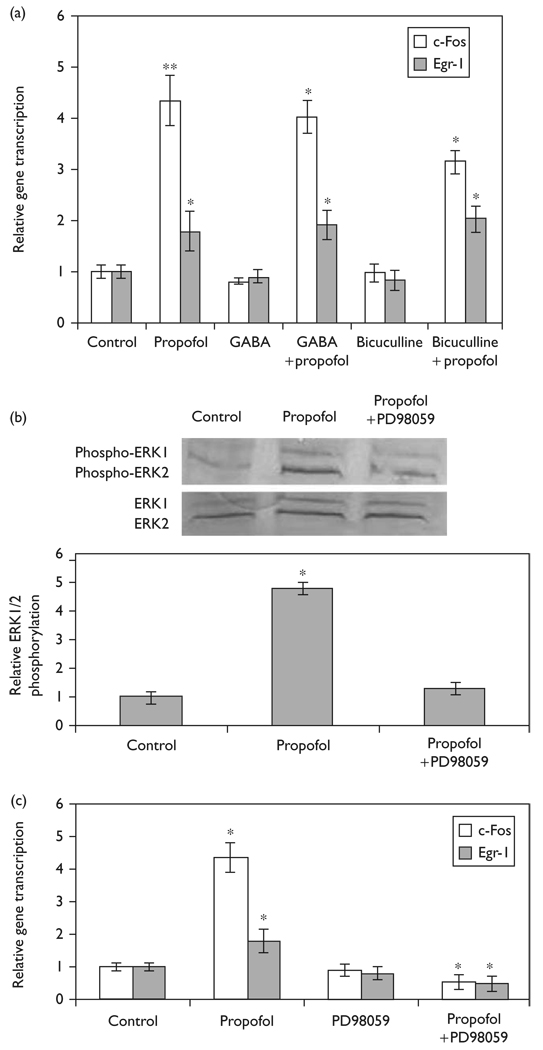
Fig. 4.
Elucidating the mechanism of propofol-induced c-Fos and Egr-1 expression in N2A cells. The transcription of c-Fos and Egr-1 was assessed using quantitative reverse transcription-PCR. (a) N2A cells in the presence and absence of GABA or bicuculline pretreatment were stimulated with propofol (16.8 µM) for 60 min. Data is presented as mean ± SD from three independent experiments. *P<0.05; **P<0.01 versus nontreated control. (b) Representative immunoblots of ERK1/2 phosphorylation and total ERK1/2 following propofol stimulation and quantification of ERK1/2 phosphorylation expressed as ratio to control. *P<0.05 versus nontreated control. (c) N2A cells with or without pretreatment of 50 µM PD98059 were stimulated with 16.8 µM propofol for 60 min and the expression of c-Fos and Egr-1 was measured using quantitative reverse transcription-PCR. Data is presented as mean ± SD from three independent experiments. *P<0.05 versus propofol treatment.

