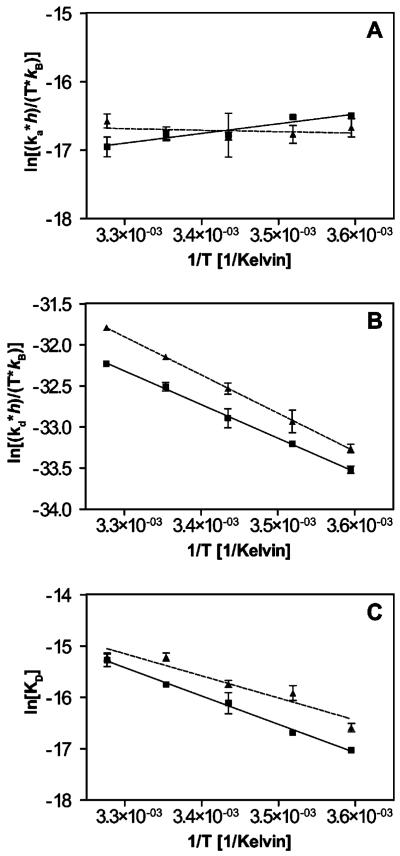
FIGURE 7.
Thermodynamic plots for the interaction of TβR-II with TGF-β3 (■) and TGF-β2-TM (▲) determined from three independent SPR experiments at each temperature point. Eyring plots are shown in panels A and B for the forward (ka), and reverse (kd) interactions, respectively. Panel C shows van't Hoff plots using equilibrium KD values determined from individual rate constants derived from the SPR data (kd/ka) at each temperature indicated.

