
Fig. 1.
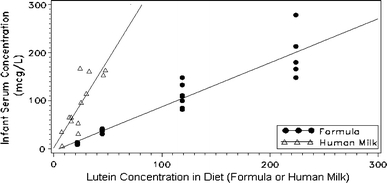
Scatterplot of serum lutein concentrations (mcg/l) at week 12 in infants fed different concentrations (mcg/l) of lutein containing formula or human milk. Solid circles represent infant formula groups and open triangles represent human milk group. Linear regression equation for formula-fed groups was Yi = −4.4 + 0.9 (formula lutein) (r 2 = 0.87, P < 0.001) and for the human milk group was Yi = 1.8 + 3.7 (human milk lutein) (r 2 = 0.67, P < 0.001). Baseline serum concentrations did not have a significant effect on final serum concentrations (P = 0.001 for human milk; P < 0.001 for formula) and the slopes shown are based on unadjusted data