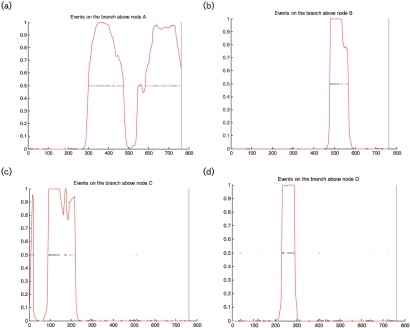
Fig. 3.
Representation of fHbp gene recombination events (a–d). The nucleotide sequence of the fHbp gene is on the x axis, with the red line indicating the probability for an import from 0 to 1 (y axis). The panels depict genetic events above nodes A, B, C and D shown in the 75 % majority-rule consensus clonalframe tree panel (Fig. 2). Each inferred substitution is indicated by a cross, the intensity of which indicates the posterior probability for that substitution. In (a), horizontal genetic exchange is depicted occurring from base 300 to base 500 and from base 550 to base 800; in (b), from base 450 to base 600; in (c), horizontal genetic exchange is depicted occurring from base 100 to base 250 and in (d) at about 200 and 300 bases.

